Albertsons 2002 Annual Report Download - page 20
Download and view the complete annual report
Please find page 20 of the 2002 Albertsons annual report below. You can navigate through the pages in the report by either clicking on the pages listed below, or by using the keyword search tool below to find specific information within the annual report.-
 1
1 -
2
-
3
-
4
-
5
-
6
-
7
-
8
-
9
-
 10
10 -
 11
11 -
 12
12 -
 13
13 -
 14
14 -
 15
15 -
 16
16 -
 17
17 -
 18
18 -
 19
19 -
 20
20 -
 21
21 -
 22
22 -
 23
23 -
 24
24 -
 25
25 -
 26
26 -
 27
27 -
 28
28 -
 29
29 -
 30
30 -
31
-
32
-
33
-
34
-
35
-
36
-
37
-
38
-
39
-
40
 |
 |

Cautionary Statements for Purposes of the Safe Harbor Provisions
of the Private Securities Litigation Reform Act of 1995
Any statements in this report regarding SUPERVALU’s outlook for its busi-
nesses and their respective markets, such as projections of future perfor-
mance, statements of management’s plans and objectives, forecasts of
market trends and other matters, are forward-looking statements based
on management’s assumptions and beliefs. Such statements may be iden-
tified by such words as “will likely result,” “are expected to,” “will continue,”
“outlook,” “is anticipated,” “estimate,” “project,” “management believes,” or
similar expressions. Such forward-looking statements are subject to certain
risks and uncertainties that could cause actual results to differ materially
from those discussed in such forward-looking statements and no assur-
ance can be given that the results in any forward-looking statement will be
achieved. For these statements, SUPERVALU claims the protection of the
safe harbor for forward-looking statements contained in the Private
Securities Litigation Reform Act of 1995.
The following is a summary of certain factors, the results of which could
cause SUPERVALU’s future results to differ materially from those expressed
or implied in any forward-looking statements contained in this report:
• competitive practices in the retail food and food distribution industries,
• the nature and extent of the consolidation of the retail food and food dis-
tribution industries,
• our ability to attract and retain customers for our food distribution busi-
ness and to control food distribution costs,
• our ability to grow through acquisitions and assimilate acquired entities,
• general economic or political conditions that affect consumer buying
habits generally or acts of terror directed at the food industry that affect
consumer behavior,
• potential work disruptions from labor disputes or national emergencies,
• the timing and implementation of certain restructure activities we have
announced, including our consolidation of certain distribution facilities and
our disposition of under-performing stores and non-operating properties,
• the availability of favorable credit and trade terms, and
• other risk factors inherent in the retail food and food distribution industries.
These risks and uncertainties are set forth in further detail in Exhibit 99(i)
to the Company’s Annual Report on Form 10-K, for the year ended
February 23, 2002. Any forward-looking statement speaks only as of the
date on which such statement is made, and SUPERVALU undertakes no
obligation to update such statement to reflect events or circumstances
arising after such date..
18
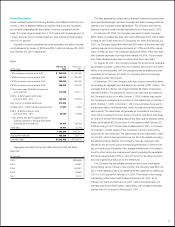
The table below provides information about the Company’s financial instruments that are sensitive to changes in interest rates, including notes receivable
and debt obligations. For debt obligations, the table presents principal cash flows and related weighted average interest rates by expected maturity dates.
For notes receivable, the table presents the expected collection of principal cash flows and weighted average interest rates by expected maturity dates.
Summary of Financial Instruments
February 23, 2002 Aggregate maturities of principal by fiscal year
(In millions, except rates) Fair Value Total 2003 2004 2005 2006 2007 Thereafter
Notes receivable
Principal receivable $ 92.7 $ 92.7 $ 23.9 $13.8 $ 13.3 $13.1 $ 7.2 $ 21.4
Average rate receivable 8.7% 8.0% 8.6% 8.9% 8.4% 9.1% 9.6%
Debt with variable interest rates
Principal payable $ 94.5 $ 94.5 $ 24.0 $ 8.0 —$ 2.4 $ 2.6 $ 57.5
Average variable rate payable 1.6% 2.4% 1.3% —1.4% 1.4% 1.3%
Debt with fixed interest rates
Principal payable $1,662.5 $1,598.5 $326.3 $23.9 $440.3 $60.5 $70.5 $677.0
Average fixed rate payable 7.6% 7.8% 8.4% 8.5% 7.2% 6.8% 7.0%