Albertsons 2002 Annual Report Download - page 15
Download and view the complete annual report
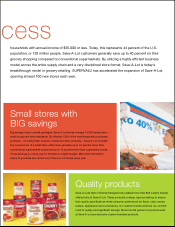
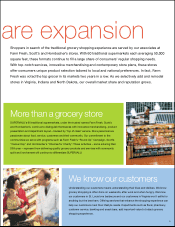
Please find page 15 of the 2002 Albertsons annual report below. You can navigate through the pages in the report by either clicking on the pages listed below, or by using the keyword search tool below to find specific information within the annual report.-
 1
1 -
2
-
3
-
4
-
 5
5 -
 6
6 -
 7
7 -
 8
8 -
 9
9 -
 10
10 -
 11
11 -
 12
12 -
 13
13 -
 14
14 -
 15
15 -
 16
16 -
 17
17 -
 18
18 -
 19
19 -
 20
20 -
 21
21 -
 22
22 -
 23
23 -
 24
24 -
 25
25 -
26
-
27
-
28
-
29
-
30
-
31
-
32
-
33
-
34
-
35
-
36
-
37
-
38
-
39
-
40
 |
 |

Excluding the impacts of restructure and other items in 2002 and 2001,
the Company’s EBIT and EBITDA were as follows: EBIT was $575.3 million
compared to $585.3 million last year, a 1.7% decrease; EBITDA was
$916.0 million compared with $921.6 million last year, a 0.6% decrease;
retail food EBIT increased 12.1% to $387.5 million, or 4.1% of net sales,
from last year’s $345.8 million, or 3.7% of net sales, primarily due to growth
in new stores and improved merchandising execution in retail; retail food
EBITDA increased 9.0% to $565.1 million, or 5.9% of net sales, from last
year’s $518.3 million, or 5.5% of net sales; food distribution EBIT
decreased 17.6% to $227.0 million, or 2.0% of net sales, from last year’s
$275.4 million, or 2.0% of net sales, reflecting a decrease in sales volume,
primarily the exit of the Kmart supply contract, partially offset by benefits
of restructure and reconfiguration activities; food distribution EBITDA
decreased 11.1% to $387.7 million, or 3.4% of net sales, from last year’s
$436.0 million, or 3.2% of net sales.
Net Interest Expense Interest expense decreased to $194.3 million in
2002, compared with $212.9 million in 2001, reflecting lower borrowing
levels and lower interest rates since last year. Interest income decreased to
$21.5 million in 2002 compared with $22.1 million in 2001.
Income Taxes The effective tax rate was 40.2 percent in 2002 compared
with 46.9 percent in 2001. Excluding the impacts of restructure and other
items for 2002 and 2001, the effective tax rate was 40.2 percent for
both years.
Net Earnings
Net earnings were $205.5 million or $1.53 per diluted share in 2002 com-
pared with 2001 net earnings of $82.0 million or $0.62 per diluted share.
Weighted average diluted shares increased to 134.0 million in 2002
compared with last year’s 132.8 million, primarily reflecting the dilutive
impact of stock options.
Excluding the impacts of restructure and other items, net earnings were
$240.7 million or $1.80 per diluted share in 2002, compared with $235.9
million or $1.78 per diluted share in 2001.
Comparison of fifty-two weeks ended February 24, 2001 (2001) with
fifty-two weeks ended February 26, 2000 (2000):
Net Sales Net sales for 2001 of $23.2 billion increased 14.0 percent from
$20.3 billion in 2000, reflecting the acquisition of Richfood in August 1999,
incremental volume from new customers, and new corporate stores. Retail
food sales increased 15.9 percent and food distribution sales increased
12.8 percent in 2001 compared to 2000. Retail food sales increased from
2000 primarily due to the Richfood acquisition and the opening of new stores
in 2001. Same-store sales were negative 3.7 percent, impacted by competi-
tive activities and cannibalization in certain markets. Food distribution sales
increased from 2000 primarily due to the Richfood acquisition and incremen-
tal volume from new customers, primarily the $2.3 billion annual supply
contract with Kmart.
Fiscal 2001 store activity, including licensed units, resulted in 117 new
stores opened, five stores acquired, and 45 stores closed or sold for a total
of 1,194 stores at year end, an increase in square footage of 6.9 percent
over 2000.
Gross Profit Gross profit as a percentage of net sales remained flat at
11.0 percent. In 2001, gross profit included $17.1 million in cost of sales
for inventory markdowns related to restructure activities.
Selling and Administrative Expenses Selling and administrative
expenses were 8.8 percent of net sales for 2001 compared to 8.4 percent of
net sales in 2000. The increase reflects $51.7 million primarily for store closing
reserves and provisions for certain uncollectible receivables. Excluding
these items, selling and administrative expenses were 8.6 percent of net
sales in 2001. The increase was primarily due to the growing proportion of
the Company’s retail business, which operates at a higher selling and
administrative expense as a percentage of net sales than does the food
distribution business.
Operating Earnings The Company’s EBIT was $345.2 million in 2001
compared to $582.8 million in 2000, a 40.8% decrease. EBITDA was
$689.0 million in 2001 compared with $859.9 million in 2000, a 19.9%
decrease. Fiscal 2001 includes $171.3 million for restructure charges and
$68.8 million primarily for store closing reserves and provisions for certain
uncollectible receivables. Fiscal 2000 includes a net $60.1 million benefit
from the gain on the sale of Hazelwood Farms Bakeries of $163.7 million,
partially offset by restructure charges of $103.6 million.
Excluding the impacts of restructure and other items in 2001 and 2000,
the Company’s EBIT and EBITDA were as follows: EBIT was $585.3 million
in 2001 compared to $522.8 million in 2000, a 12.0% increase; EBITDA
was $921.6 million in 2001 compared with $799.8 million in 2000, a 15.2%
increase; retail food EBIT increased 1.5% to $345.8 million, or 3.7% of net
sales, from $340.7 million in 2000, or 4.2% of net sales, primarily due to the
Richfood acquisition and the opening of 117 stores, substantially offset by
increased advertising, promotional spending, and labor costs; retail food
EBITDA increased 5.7% to $518.3 million, or 5.5% of net sales, from $490.3
million in 2000, or 6.1% of net sales; food distribution EBIT increased
23.3% to $275.4 million, or 2.0% of net sales, from $223.4 million, or 1.8%
of net sales, in 2000; EBIT for food distribution, as a percentage of net
sales, increased to 2.0% in 2001 compared to 1.8% in 2000, primarily
due to the Richfood acquisition and the incremental volume from other
customers, primarily Kmart; food distribution EBITDA increased 25.4% to
$436.0 million, or 3.2% of net sales, from $347.6 million in 2000, or 2.8%
of net sales.
Net Interest Expense Interest expense increased to $212.9 million
in 2001, compared with $154.5 million in 2000, reflecting increased bor-
rowings due to the Richfood acquisition in August 1999 and the $140 mil-
lion share buyback under the December 1999 treasury stock program
completed early in the first quarter of 2001. Interest income increased to
$22.1 million in 2001 compared with $19.1 million in 2000.
13