Tesco 2013 Annual Report Download - page 97
Download and view the complete annual report
Please find page 97 of the 2013 Tesco annual report below. You can navigate through the pages in the report by either clicking on the pages listed below, or by using the keyword search tool below to find specific information within the annual report.-
 1
1 -
2
-
3
-
4
-
5
-
6
-
7
-
8
-
9
-
10
-
11
-
12
-
13
-
14
-
15
-
16
-
17
-
18
-
19
-
20
-
21
-
22
-
23
-
24
-
25
-
26
-
27
-
28
-
29
-
30
-
31
-
32
-
33
-
34
-
35
-
36
-
37
-
38
-
39
-
40
-
41
-
42
-
43
-
44
-
45
-
46
-
47
-
48
-
49
-
50
-
51
-
52
-
53
-
54
-
55
-
56
-
57
-
58
-
59
-
60
-
61
-
62
-
63
-
64
-
65
-
66
-
67
-
68
-
69
-
70
-
71
-
72
-
73
-
74
-
75
-
76
-
77
-
78
-
79
-
80
-
81
-
82
-
83
-
84
-
85
-
86
-
 87
87 -
 88
88 -
 89
89 -
 90
90 -
 91
91 -
 92
92 -
 93
93 -
 94
94 -
 95
95 -
 96
96 -
 97
97 -
 98
98 -
 99
99 -
 100
100 -
 101
101 -
 102
102 -
 103
103 -
 104
104 -
 105
105 -
 106
106 -
 107
107 -
108
-
109
-
110
-
111
-
112
-
113
-
114
-
115
-
116
-
117
-
118
-
119
-
120
-
121
-
122
-
123
-
124
-
125
-
126
-
127
-
128
-
129
-
130
-
131
-
132
-
133
-
134
-
135
-
136
-
137
-
138
-
139
-
140
-
141
-
142
 |
 |

93
Tesco PLC Annual Report and Financial Statements 2013
OVERVIEW BUSINESS REVIEW PERFORMANCE REVIEW GOVERNANCE FINANCIAL STATEMENTS
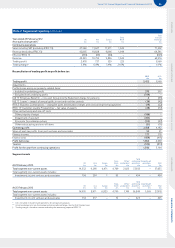
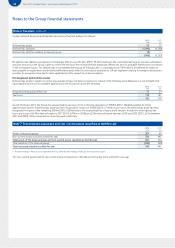
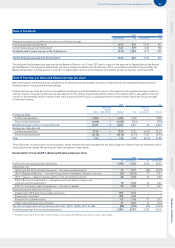
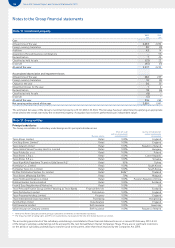
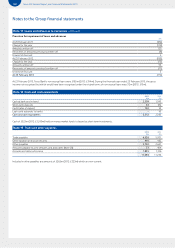
Note 8 Dividends
2013 2012
pence/share £m pence/share £m
Amounts recognised as distributions to owners in the financial year:
Prior financial year final dividend 10.13 813 10.09 811
Current financial year interim dividend 4.63 371 4.63 369
Dividends paid to equity owners in the financial year 14.76 1,184 14.72 1,180
Current financial year proposed final dividend 10.13 815 10.13 815
The proposed final dividend was approved by the Board of Directors on 16 April 2013 and is subject to the approval of shareholders at the Annual
General Meeting. The proposed dividend has not been included as a liability as at 23 February 2013, in accordance with IAS 10 ‘Events After the
Balance Sheet Date’. It will be paid on 5 July 2013 to shareholders who are on the Register of members at close of business on 26 April 2013.
Note 9 Earnings per share and diluted earnings per share
Basic earnings per share amounts are calculated by dividing the profit attributable to owners of the parent by the weighted average number of
ordinary shares in issue during the financial year.
Diluted earnings per share amounts are calculated by dividing the profit attributable to owners of the parent by the weighted average number of
ordinary shares in issue during the financial year adjusted for the effects of potentially dilutive options. The dilutive effect is calculated on the full
exercise of all potentially dilutive ordinary share options granted by the Group, including performance-based options which the Group considers
to have been earned.
2013 2012
Basic
Potentially
dilutive
share options Diluted Basic
Potentially
dilutive
share options Diluted
Profit/(loss) (£m)
Continuing operations 1,390 –1,390 3,156 –3,156
Discontinued operations (1,266) –(1,266) (350) –(350)
Weighted average number of shares (millions) 8,033 48,037 8,021 24 8,045
Earnings per share (pence)
Continuing operations 17. 30 –17. 30 39.35 (0.12) 39.23
Discontinued operations (15.76) –(15.76) (4.37) 0.02 (4.35)
Total 1.54 –1.54 34.98 (0.10) 34.88
There have been no transactions involving ordinary shares between the reporting date and the date of approval of these financial statements which
would significantly change the earnings per share calculations shown above.
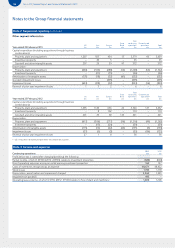
Reconciliation of non-GAAP underlying diluted earnings per share
2013 2012
£m pence/share £m pence/share
Profit from continuing operations (Diluted) 1,390 17. 30 3,156 39.23
Adjustments for:
IAS 32 and IAS 39 ‘Financial Instruments’ – fair value remeasurements 14 0.17 (44) (0.55)
IAS 19 ‘Employee Benefits’ – non-cash Group Income Statement charge for pensions (56) (0.70) 17 0.21
IAS 17 ‘Leases’ – impact of annual uplifts in rent and rent-free periods 28 0.35 31 0.39
IFRS 3 ‘Business Combinations’ – intangible asset amortisation charges and
costs arising from acquisitions 19 0.24 22 0.27
IFRIC 13 ‘Customer Loyalty Programmes’ – fair value of awards 28 0.35 17 0.21
Restructuring and other one-off costs
Impairment of PPE and onerous lease provisions 895 11.14 – –
Impairment of goodwill 495 6.16 – –
Provision for customer redress 115 1.43 57 0.71
Other restructuring and one-off items 51 0.63 11 0.14
Tax effect of adjustments at the effective rate of tax* (2013: 18.6%, 2012: 21.6%) (88) (1.10) (24) (0.30)
Underlying earnings from continuing operations 2,891 35.97 3,243 40.31
* The effective tax rate of 18.6% (2012: 21.6%) excludes certain permanent differences on which tax relief is not available.