Tesco 2013 Annual Report Download - page 79
Download and view the complete annual report
Please find page 79 of the 2013 Tesco annual report below. You can navigate through the pages in the report by either clicking on the pages listed below, or by using the keyword search tool below to find specific information within the annual report.-
 1
1 -
2
-
3
-
4
-
5
-
6
-
7
-
8
-
9
-
10
-
11
-
12
-
13
-
14
-
15
-
16
-
17
-
18
-
19
-
20
-
21
-
22
-
23
-
24
-
25
-
26
-
27
-
28
-
29
-
30
-
31
-
32
-
33
-
34
-
35
-
36
-
37
-
38
-
39
-
40
-
41
-
42
-
43
-
44
-
45
-
46
-
47
-
48
-
49
-
50
-
51
-
52
-
53
-
54
-
55
-
56
-
57
-
58
-
59
-
60
-
61
-
62
-
63
-
64
-
65
-
66
-
67
-
68
-
 69
69 -
 70
70 -
 71
71 -
 72
72 -
 73
73 -
 74
74 -
 75
75 -
 76
76 -
 77
77 -
 78
78 -
 79
79 -
 80
80 -
 81
81 -
 82
82 -
 83
83 -
 84
84 -
 85
85 -
 86
86 -
 87
87 -
 88
88 -
 89
89 -
90
-
91
-
92
-
93
-
94
-
95
-
96
-
97
-
98
-
99
-
100
-
101
-
102
-
103
-
104
-
105
-
106
-
107
-
108
-
109
-
110
-
111
-
112
-
113
-
114
-
115
-
116
-
117
-
118
-
119
-
120
-
121
-
122
-
123
-
124
-
125
-
126
-
127
-
128
-
129
-
130
-
131
-
132
-
133
-
134
-
135
-
136
-
137
-
138
-
139
-
140
-
141
-
142
 |
 |

75
Tesco PLC Annual Report and Financial Statements 2013
OVERVIEW BUSINESS REVIEW PERFORMANCE REVIEW GOVERNANCE FINANCIAL STATEMENTS
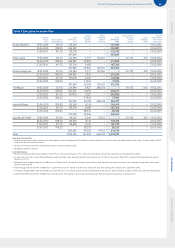
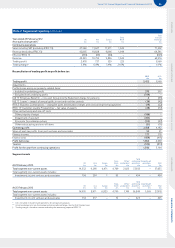
Group statement of changes in equity
All other reserves
Issued
share
capital
£m
Share
premium
£m
Other
reserves
£m
Capital
redemption
reserve
£m
Hedging
reserve
£m
Translation
reserve
£m
Treasury
shares
£m
Retained
earnings
£m
Total
£m
Non-
controlling
interests
£m
Total
equity
£m
At 25 February 2012 402 4,964 40 16 73 134 (18) 12,164 17,775 26 17, 801
Profit for the year –––––––124 124 (4) 120
Other comprehensive income
Change in fair value of available-for-sale
financial assets and investments – – – – – – – (11) (11) –(11)
Currency translation differences – – – – – 420 – – 420 –420
Reclassification adjustment on
subsidiaries disposed – – – – – 20 – – 20 –20
Actuarial losses on defined benefit
pension schemes – – – – – – – (735) (735) –(735)
Gains on cash flow hedges – – – – 21 – – – 21 –21
Tax relating to components of other
comprehensive income – – – – (3) (27) –134 104 –104
Total other comprehensive income – – – – 18 413 –(612) (181) –(181)
Total comprehensive income – – – – 18 413 –(488) (57) (4) (61)
Transactions with owners
Share-based payments – – – – – – 9 44 53 –53
Issue of shares 156 – – – – – – 57 –57
Purchase of non-controlling interests – – – – – – – 4 4 (4) –
Dividends authorised in the year – – – – – – – (1,184) (1,184) –(1,184)
Tax on items charged to equity – – – – – – – (5) (5) –(5)
Total transactions with owners 156 – – – – 9 (1,141) (1,075) (4) (1,079)
At 23 February 2013 403 5,020 40 16 91 547 (9) 10,535 16,643 18 16,661
All other reserves
Issued
share
capital
£m
Share
premium
£m
Other
reserves
£m
Capital
redemption
reserve
£m
Hedging
reserve
£m
Translation
reserve
£m
Treasury
shares
£m
Retained
earnings
£m
Total
£m
Non-
controlling
interests
£m
Total
equity
£m
At 26 February 2011 402 4,896 40 13 (1) 155 (141) 11,171 16,535 88 16,623
Profit for the year – – – – – – – 2,806 2,806 82,814
Other comprehensive income
Change in fair value of available-for-sale
financial assets and investments – – – – – – – 13 13 –13
Currency translation differences – – – – – (27) – – (27) 5(22)
Actuarial losses on defined benefit
pension schemes – – – – – – – (498) (498) –(498)
Gains on cash flow hedges – – – – 99 – – – 99 –99
Tax relating to components of other
comprehensive income – – – – (25) 6 – 92 73 –73
Total other comprehensive income – – – – 74 (21) –(393) (340) 5 (335)
Total comprehensive income – – – – 74 (21) –2,413 2,466 13 2,479
Transactions with owners
Purchase of treasury shares – – – – – – (13) –(13) –(13)
Shares purchased for cancellation (3) – – 3 – – – (290) (290) – (290)
Share-based payments 2 – – – – – 136 (13) 125 –125
Issue of shares 168 – – – – – – 69 –69
Purchase of non-controlling interests – – – – – – – 72 72 (72) –
Future purchase of non-controlling interests – – – – – – – (3) (3) –(3)
Dividends paid to non-controlling interests –––––––––(3) (3)
Dividends authorised in the year – – – – – – – (1,180) (1,180) –(1,180)
Tax on items charged to equity – – – – – – – (6) (6) –(6)
Total transactions with owners –68 – 3 – – 123 (1,420) (1,226) (75) (1,301)
At 25 February 2012 402 4,964 40 16 73 134 (18) 12,164 17,775 26 17, 801
The notes on pages 77 to 125 form part of these financial statements.