Tesco 2013 Annual Report Download - page 90
Download and view the complete annual report
Please find page 90 of the 2013 Tesco annual report below. You can navigate through the pages in the report by either clicking on the pages listed below, or by using the keyword search tool below to find specific information within the annual report.-
 1
1 -
2
-
3
-
4
-
5
-
6
-
7
-
8
-
9
-
10
-
11
-
12
-
13
-
14
-
15
-
16
-
17
-
18
-
19
-
20
-
21
-
22
-
23
-
24
-
25
-
26
-
27
-
28
-
29
-
30
-
31
-
32
-
33
-
34
-
35
-
36
-
37
-
38
-
39
-
40
-
41
-
42
-
43
-
44
-
45
-
46
-
47
-
48
-
49
-
50
-
51
-
52
-
53
-
54
-
55
-
56
-
57
-
58
-
59
-
60
-
61
-
62
-
63
-
64
-
65
-
66
-
67
-
68
-
69
-
70
-
71
-
72
-
73
-
74
-
75
-
76
-
77
-
78
-
79
-
 80
80 -
 81
81 -
 82
82 -
 83
83 -
 84
84 -
 85
85 -
 86
86 -
 87
87 -
 88
88 -
 89
89 -
 90
90 -
 91
91 -
 92
92 -
 93
93 -
 94
94 -
 95
95 -
 96
96 -
 97
97 -
 98
98 -
 99
99 -
 100
100 -
101
-
102
-
103
-
104
-
105
-
106
-
107
-
108
-
109
-
110
-
111
-
112
-
113
-
114
-
115
-
116
-
117
-
118
-
119
-
120
-
121
-
122
-
123
-
124
-
125
-
126
-
127
-
128
-
129
-
130
-
131
-
132
-
133
-
134
-
135
-
136
-
137
-
138
-
139
-
140
-
141
-
142
 |
 |

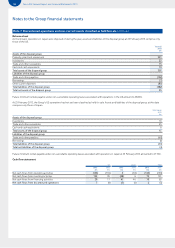
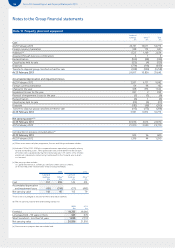
86 Tesco PLC Annual Report and Financial Statements 2013
Notes to the Group financial statements
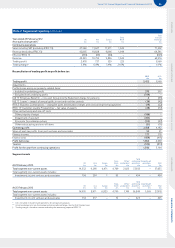
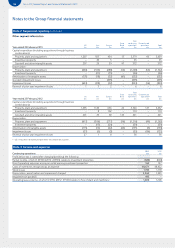
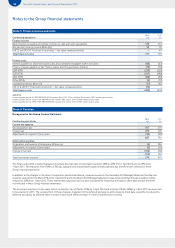
Note 2 Segmental reporting continued
Other segment information
Year ended 23 February 2013 UK
£m
Asia
£m
Europe
£m
Tesco
Bank
£m
Total
continuing
operations
£m
Discontinued
operations
£m
Total
£m
Capital expenditure (including acquisitions through business
combinations):
Property, plant and equipment 1,207 925 434 13 2,579 60 2,639
Investment property –40 3 – 43 –43
Goodwill and other intangible assets 207 29 39 97 372 –372
Depreciation:
Property, plant and equipment (630) (334) (288) (16) (1,268) (54) (1,322)
Investment property –(21) (15) –(36) –(36)
Amortisation of intangible assets (131) (18) (22) (61) (232) –(232)
Goodwill impairment losses - – (495) –(495) –(495)
Impairment losses (654) (88) (92) –(834) (16) (850)
Reversal of prior year impairment losses 1 3 2 – 6 – 6
Year ended 25 February 2012 UK
£m
Asia
£m
Europe
£m
Tesco
Bank
£m
Total
continuing
operations
£m
Discontinued
operations*
£m
Total
£m
Capital expenditure (including acquisitions through business
combinations):
Property, plant and equipment 1,495 1,140 663 22 3,320 147 3,467
Investment property – 8 102 –110 –110
Goodwill and other intangible assets 201 29 68 143 441 –441
Depreciation:
Property, plant and equipment (617) (306) (277) (16) (1,216) (49) (1,265)
Investment property –(15) (24) –(39) –(39)
Amortisation of intangible assets (113) (12) (22) (44) (191) (3) (194)
Impairment losses (27) (5) (3) –(35) (86) (121)
Reversal of prior year impairment losses 27 1 8 – 36 –36
* US is included in discontinued operations for comparison purposes.
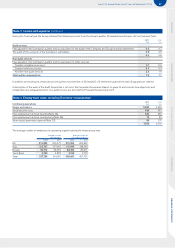
Note 3 Income and expenses
Continuing operations 2013
£m
2012
£m
Profit before tax is stated after charging/(crediting) the following:
Rental income, of which £493m (2012: £499m) relates to investment properties (620) (604)
Direct operating expenses arising on rental earning investment properties 165 157
Costs of inventories recognised as an expense 48,671 48,422
Stock losses 1,193 1,118
Depreciation, amortisation and impairment charged 2,364 1,445
Impairment of goodwill 495 –
Operating lease expense, of which £127m (2012: £133m) relates to hire of plant and machinery 1,400 1,206