Tesco 2013 Annual Report Download - page 123
Download and view the complete annual report
Please find page 123 of the 2013 Tesco annual report below. You can navigate through the pages in the report by either clicking on the pages listed below, or by using the keyword search tool below to find specific information within the annual report.-
 1
1 -
2
-
3
-
4
-
5
-
6
-
7
-
8
-
9
-
10
-
11
-
12
-
13
-
14
-
15
-
16
-
17
-
18
-
19
-
20
-
21
-
22
-
23
-
24
-
25
-
26
-
27
-
28
-
29
-
30
-
31
-
32
-
33
-
34
-
35
-
36
-
37
-
38
-
39
-
40
-
41
-
42
-
43
-
44
-
45
-
46
-
47
-
48
-
49
-
50
-
51
-
52
-
53
-
54
-
55
-
56
-
57
-
58
-
59
-
60
-
61
-
62
-
63
-
64
-
65
-
66
-
67
-
68
-
69
-
70
-
71
-
72
-
73
-
74
-
75
-
76
-
77
-
78
-
79
-
80
-
81
-
82
-
83
-
84
-
85
-
86
-
87
-
88
-
89
-
90
-
91
-
92
-
93
-
94
-
95
-
96
-
97
-
98
-
99
-
100
-
101
-
102
-
103
-
104
-
105
-
106
-
107
-
108
-
109
-
110
-
111
-
112
-
 113
113 -
 114
114 -
 115
115 -
 116
116 -
 117
117 -
 118
118 -
 119
119 -
 120
120 -
 121
121 -
 122
122 -
 123
123 -
 124
124 -
 125
125 -
 126
126 -
 127
127 -
 128
128 -
 129
129 -
 130
130 -
 131
131 -
 132
132 -
 133
133 -
134
-
135
-
136
-
137
-
138
-
139
-
140
-
141
-
142
 |
 |

119
Tesco PLC Annual Report and Financial Statements 2013
OVERVIEW BUSINESS REVIEW PERFORMANCE REVIEW GOVERNANCE FINANCIAL STATEMENTS
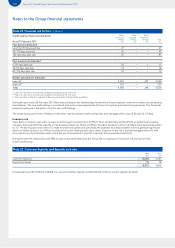
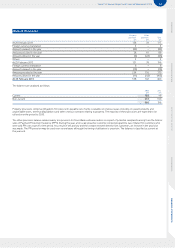
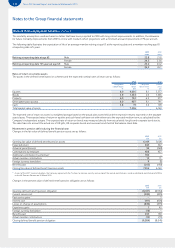
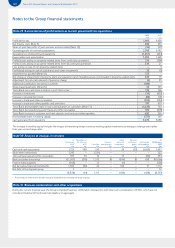
Note 26 Post-employment benefits continued
The amounts that have been charged to the Group Income Statement and Group Statement of Comprehensive Income for the year ended
23February 2013 are set out below:
2013
£m
2012
£m
Analysis of the amount charged to operating profit:
Current service cost (482) (495)
Past service gains – 3
Total charge to operating profit (482) (492)
Analysis of the amount (charged)/credited to finance (cost)/income:
Expected return on defined benefit pension assets 463 422
Interest on defined benefit pension obligation (411) (404)
Net pension finance income (Note 5) 52 18
Total charge to the Group Income Statement (430) (474)
Analysis of the amount recognised in the Group Statement of Comprehensive Income:
Actuarial gains/(losses) on defined benefit pension assets 94 (168)
Experience gains arising on defined benefit pension obligation 1 43
Foreign currency translation (7) –
Losses on change of assumptions on defined benefit pension obligation (830) (373)
Total losses recognised in the Group Statement of Comprehensive Income (742) (498)
The cumulative losses recognised through the Group Statement of Comprehensive Income since the date of transition to IFRS are £1,965m (2012: £1,223m).
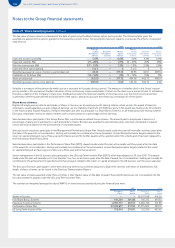
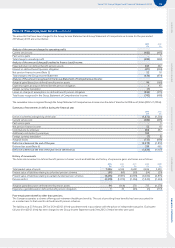
Summary of movements in deficit during the financial year
2013
£m
2012
£m
Deficit in schemes at beginning of the year (1,872) (1,356)
Current service cost (482) (495)
Past service gains – 3
Net pension finance income 52 18
Contributions by employer 486 457
Additional contribution by employer 180 –
Foreign currency translation (7) (1)
Actuarial losses (735) (498)
Deficit in schemes at the end of the year (2,378) (1,872)
Deferred tax asset (Note 6) 539 465
Deficit in schemes at the end of the year net of deferred tax (1,839) (1,407)
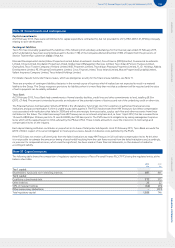
History of movements
The historical movement in defined benefit pension schemes’ assets and liabilities and history of experience gains and losses are as follows:
2013
£m
2012
£m
2011
£m
2010
£m
2009
£m
Total market value of assets 7,20 6 6,169 5,608 4,696 3,420
Present value of liabilities relating to unfunded pension schemes (91) (60) (65) (54) (39)
Present value of liabilities relating to partially funded pension schemes (9,493) ( 7,981) (6,899) (6,482) (4,875)
Pension deficit (2,378) (1,872) (1,356) (1,840) (1,494)
Actuarial gains/(losses) on defined benefit pension assets 94 (168) 278 733 (1,270)
Experience gains/(losses) on defined benefit pension obligation 143 (25) (1) (117 )
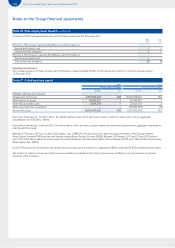
Post-employment benefits other than pensions
The Company operates a scheme offering post-retirement healthcare benefits. The cost of providing these benefits has been accounted for
on a similar basis to that used for defined benefit pension schemes.
The liability as at 23 February 2013 of £12m (2012: £11m) was determined in accordance with the advice of independent actuaries. During the
full year £1m (2012: £1m) has been charged to the Group Income Statement and £1m (2012: £1m) of benefits were paid.