Tesco 2013 Annual Report Download - page 120
Download and view the complete annual report
Please find page 120 of the 2013 Tesco annual report below. You can navigate through the pages in the report by either clicking on the pages listed below, or by using the keyword search tool below to find specific information within the annual report.-
 1
1 -
2
-
3
-
4
-
5
-
6
-
7
-
8
-
9
-
10
-
11
-
12
-
13
-
14
-
15
-
16
-
17
-
18
-
19
-
20
-
21
-
22
-
23
-
24
-
25
-
26
-
27
-
28
-
29
-
30
-
31
-
32
-
33
-
34
-
35
-
36
-
37
-
38
-
39
-
40
-
41
-
42
-
43
-
44
-
45
-
46
-
47
-
48
-
49
-
50
-
51
-
52
-
53
-
54
-
55
-
56
-
57
-
58
-
59
-
60
-
61
-
62
-
63
-
64
-
65
-
66
-
67
-
68
-
69
-
70
-
71
-
72
-
73
-
74
-
75
-
76
-
77
-
78
-
79
-
80
-
81
-
82
-
83
-
84
-
85
-
86
-
87
-
88
-
89
-
90
-
91
-
92
-
93
-
94
-
95
-
96
-
97
-
98
-
99
-
100
-
101
-
102
-
103
-
104
-
105
-
106
-
107
-
108
-
109
-
 110
110 -
 111
111 -
 112
112 -
 113
113 -
 114
114 -
 115
115 -
 116
116 -
 117
117 -
 118
118 -
 119
119 -
 120
120 -
 121
121 -
 122
122 -
 123
123 -
 124
124 -
 125
125 -
 126
126 -
 127
127 -
 128
128 -
 129
129 -
 130
130 -
131
-
132
-
133
-
134
-
135
-
136
-
137
-
138
-
139
-
140
-
141
-
142
 |
 |

116 Tesco PLC Annual Report and Financial Statements 2013
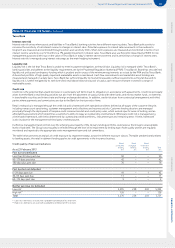
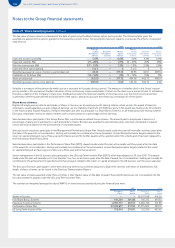
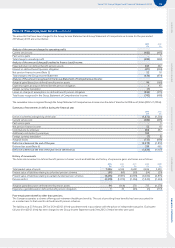
Note 25 Share-based payments continued
The fair value of share options is estimated at the date of grant using the Black-Scholes option pricing model. The following table gives the
assumptions applied to the options granted in the respective periods shown. No assumption has been made to incorporate the effects of expected
early exercise.
2013 2012
Savings-
related
share option
schemes
Executive
share option
schemes
Nil cost
option
schemes
Savings-
related
share option
schemes
Executive
share option
schemes
Nil cost
share option
schemes
Expected dividend yield (%) 5.0% –0.0% 4.1% 4.1% 0.0%
Expected volatility (%) 21 – 28% –27% 23 – 27% 26% 26%
Risk-free interest rate (%) 0.7 – 1.0% –1.3% 1.5 – 1.8% 2.0% 2.6%
Expected life of option (years) 3 or 5 – 6 3 or 5 6 6
Weighted average fair value of options granted (pence) 43.45 – 317.72 69.85 62.91 408.14
Probability of forfeiture (%) 14 – 16% –0% 14 – 16% 10% 0%
Share price (pence) 312.0 0 –317.72 404.00 402.75 408.14
Weighted average exercise price (pence) 282.00 –0.00 364.00 402.75 0.00
Volatility is a measure of the amount by which a price is expected to fluctuate during a period. The measure of volatility used in the Group’s option
pricing models is the annualised standard deviation of the continuously compounded rates of return on the share over a period of time. In estimating
the future volatility of the Company’s share price, the Board considers the historical volatility of the share price over the most recent period that
is generally commensurate with the expected term of the option, taking into account the remaining contractual life of the option.
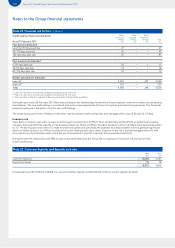
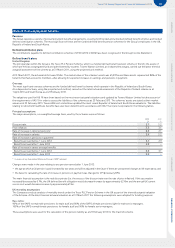
Share bonus schemes
Eligible UK employees are able to participate in Shares in Success, an all-employee profit-sharing scheme which permits the award of shares to
employees, usually awarded as a percentage of earnings, up to a statutory maximum of £3,000 per annum. No award was made under this scheme
in the financial year. Eligible Republic of Ireland employees are able to participate in a Share Bonus Scheme, an all-employee profit-sharing scheme.
Each year, employees receive an award of either cash or shares based on a percentage of their earnings.
Selected executives participate in the Group Bonus Plan, a performance-related bonus scheme. The amount paid to employees is based on a
percentage of salary and is paid partly in cash and partly in shares. Bonuses are awarded to selected executives who have completed a required
service period and depend on the achievement of corporate targets.
Selected senior executives participate in the Management Performance Share Plan. Awards made under this plan will normally vest three years after
the date of the award for nil consideration. Vesting will normally be conditional on the achievement of specified performance targets related to the
return on capital employed over a three-year performance period. No further awards will be granted under this scheme and it has been replaced by
the Performance Share Plan (2011).
Selected executives participate in the Performance Share Plan (2011). Awards made under this plan will normally vest three years after the date
of the award for nil consideration. Vesting will normally be conditional on the achievement of specified performance targets related to the return
on capital employed and earnings per share over a three-year performance period.
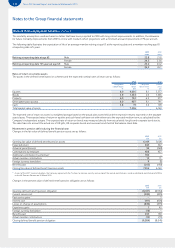
Senior management in the US business also participate in the US Long-Term Incentive Plan (2007), which was adopted on 29 June 2007. The awards
made under this plan will normally vest in four tranches: four, five, six and seven years after the date of award, for nil consideration. Vesting will normally be
conditional on the achievement of specified performance targets related to the return on capital employed in the US business over the seven-year plan.
The Executive Directors participate in short-term and long-term bonus schemes designed to align their interests with those of shareholders. Full
details of these schemes can be found in the Directors’ Remuneration Report.
The fair value of shares awarded under these schemes is their market value on the date of award. Expected dividends are not incorporated into the
fair value except for awards under the US Long-Term Incentive Plan.
The number and weighted average fair value (‘WAFV’) of share bonuses awarded during the financial year were:
2013 2012
Number of
shares
WAFV
pence
Number of
shares
WAFV
pence
Shares in Success – – 26,597,598 416.26
Irish Share Bonus Scheme 110, 234 301.08 156,313 419.50
Executive Incentive Scheme 4,591,717 301.13 9,482,746 415.89
Performance Share Plan 27,025,617 317.34 21,075,604 389.13
US Long-Term Incentive Plan 178,914 314.91 132,786 405.63
Notes to the Group financial statements