Tesco 2013 Annual Report Download - page 20
Download and view the complete annual report
Please find page 20 of the 2013 Tesco annual report below. You can navigate through the pages in the report by either clicking on the pages listed below, or by using the keyword search tool below to find specific information within the annual report.-
 1
1 -
2
-
3
-
4
-
5
-
6
-
7
-
8
-
9
-
 10
10 -
 11
11 -
 12
12 -
 13
13 -
 14
14 -
 15
15 -
 16
16 -
 17
17 -
 18
18 -
 19
19 -
 20
20 -
 21
21 -
 22
22 -
 23
23 -
 24
24 -
 25
25 -
 26
26 -
 27
27 -
 28
28 -
 29
29 -
 30
30 -
31
-
32
-
33
-
34
-
35
-
36
-
37
-
38
-
39
-
40
-
41
-
42
-
43
-
44
-
45
-
46
-
47
-
48
-
49
-
50
-
51
-
52
-
53
-
54
-
55
-
56
-
57
-
58
-
59
-
60
-
61
-
62
-
63
-
64
-
65
-
66
-
67
-
68
-
69
-
70
-
71
-
72
-
73
-
74
-
75
-
76
-
77
-
78
-
79
-
80
-
81
-
82
-
83
-
84
-
85
-
86
-
87
-
88
-
89
-
90
-
91
-
92
-
93
-
94
-
95
-
96
-
97
-
98
-
99
-
100
-
101
-
102
-
103
-
104
-
105
-
106
-
107
-
108
-
109
-
110
-
111
-
112
-
113
-
114
-
115
-
116
-
117
-
118
-
119
-
120
-
121
-
122
-
123
-
124
-
125
-
126
-
127
-
128
-
129
-
130
-
131
-
132
-
133
-
134
-
135
-
136
-
137
-
138
-
139
-
140
-
141
-
142
 |
 |

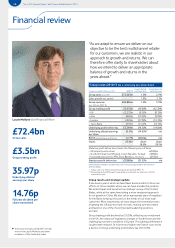
16 Tesco PLC Annual Report and Financial Statements 2013
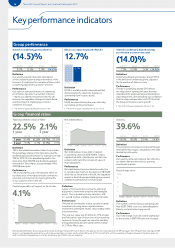
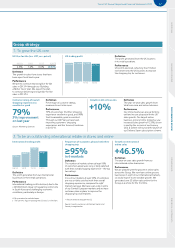
Key performance indicators
Group performance
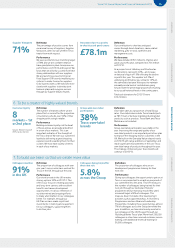
Growth in underlying profit before tax
(14.5)%
Return on capital employed (‘ROCE’)
12.7%
Growth in underlying diluted earnings
per share (at a constant tax rate)
(14.0)%
09/10 10/11 11/12 12/13
8.7% 12.3% 2.1%†(14.5)%
Definition
Our underlying profit provides information
on the underlying trend and performance of the
business. It is adjusted for a number of (non-cash)
accounting adjustments and one-off costs.
Performance
Our year-on-year performance in underlying
profit before tax reflects a number of factors
– mainly our planned investment into the UK
business, the regulatory changes in South Korea
and the impact of challenging economic
conditions in Europe.
† The 2011/12 figure including the US was 1.6%.
11/12 12/13
14.7%†
12.7%
09/10 10/11 11/12 12/13
7.7% 10.8% 2.6%†(14.0)%
Definition
Underlying diluted earnings per share (‘EPS’)
is the amount of underlying profit, adjusted
for the number of shares in issue.
Performance
The fall in underlying diluted EPS reflects
the reduction of earnings this year. We have
maintained the proposed full year dividend per
share despite this, demonstrating our confidence
that the steps we have taken in 2012/13 will set
the Group on track to resume growth.
† The 2011/12 figure including the US was 2.1%.
Definition
ROCE is a relative profit measurement that
demonstrates the return the business is
generating from its gross assets.
Performance
ROCE decreased during the year, reflecting
our trading profit performance.
† The 2011/12 figure including the US was 13.3%.
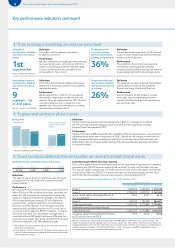
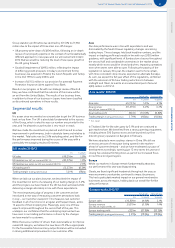
Group financial ratios
Total shareholder return (‘TSR’) Net indebtedness
1
2
3
4
12/1311/1210/1109/1008/0907/08
Times
Definition
Net indebtedness shows debt in relation
to operating cash flow (‘EBITDAR’). Debt is
adjusted net debt, calculated as net debt, the
pension deficit and the net present value of
lease obligations.
Performance
Net indebtedness has risen despite a reduction
in net debt, due mainly to the decline in EBITDAR
driven by our investment in the UK, the regulatory
impact in South Korea and challenging economic
conditions, particularly in Central Europe.
Gearing
39.6%
22.5%
1 year 2 .1%
5 year
09/10 10/11 11/12 12/13
1 year 30.4% (0.2)% (18.7%) 22.5%
5 year 9.5% 6.7% (3.0%) 2.1%
Definition
TSR is the notional annualised return from a share:
the percentage change in the share price, plus the
dividends paid and reinvested. For example, five-year
TSR for 2012/13 is the annualised growth in the
share price from 2007/08 and dividends paid and
reinvested in Tesco shares, as a percentage of the
2007/08 share price.
Performance
TSR increased this year, reflecting the effect on
our share price of increased investor confidence
since last year’s decision to invest significantly
in our customer offer in the UK.
09/10 10/11 11/12 12/13
54.0% 40.8% 38.4% 39.6%
Definition
The proportion of net assets financed through
debt rather than equity, calculated as net debt
divided by total equity.
Performance
Our gearing remained relatively flat reflecting
our stable debt position and our growing
investment in assets.
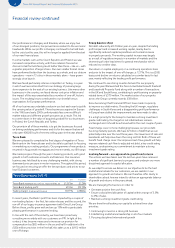
Fixed charge cover
2
4
6
8
12/1311/1210/1109/1008/0907/08
Times
Definition
The number of times that our operating cash
flow (‘EBITDAR’) covers our debt obligations
(largely rent and interest payments).
Performance
Our fixed charge cover decreased slightly due
to the decline in EBITDAR and rent increases.
Capital expenditure (‘capex’) as % of sales
4 .1%
0
2
4
6
8
12/1310/1108/0906/0704/0502/03
%
Definition
Capex is the investment in property, plant and
equipment, investment property and intangible
assets. This is divided by Group sales (inc. VAT,
inc. petrol) to show a relative investment to sales.
Performance
This year we continued to reduce our rate of capital
investment, focusing on less capital-intensive
investments with higher returns, most notably online
and convenience.
This year our capex was £3 billion or 4.1% of sales
and fell year-on-year in every one of our reporting
segments. Going forward, we intend to carefully
and appropriately allocate capital within a range
of 3.5% to 4% of sales.
More detailed definitions for our Group performance and Group financial KPIs can be found in the glossary on the inside back cover. All KPIs on pages 16 to 19 (apart from Gearing and TSR
where it is not appropriate) exclude the results from our operations in Japan and the United States for 2011/12 and 2012/13, with the exception of Supplier Viewpoint, Donation of pre-tax
profits to charities and good causes, and our Greenhouse gas (‘GHG’) emission reporting.