Tesco 2013 Annual Report Download - page 78
Download and view the complete annual report
Please find page 78 of the 2013 Tesco annual report below. You can navigate through the pages in the report by either clicking on the pages listed below, or by using the keyword search tool below to find specific information within the annual report.-
 1
1 -
2
-
3
-
4
-
5
-
6
-
7
-
8
-
9
-
10
-
11
-
12
-
13
-
14
-
15
-
16
-
17
-
18
-
19
-
20
-
21
-
22
-
23
-
24
-
25
-
26
-
27
-
28
-
29
-
30
-
31
-
32
-
33
-
34
-
35
-
36
-
37
-
38
-
39
-
40
-
41
-
42
-
43
-
44
-
45
-
46
-
47
-
48
-
49
-
50
-
51
-
52
-
53
-
54
-
55
-
56
-
57
-
58
-
59
-
60
-
61
-
62
-
63
-
64
-
65
-
66
-
67
-
 68
68 -
 69
69 -
 70
70 -
 71
71 -
 72
72 -
 73
73 -
 74
74 -
 75
75 -
 76
76 -
 77
77 -
 78
78 -
 79
79 -
 80
80 -
 81
81 -
 82
82 -
 83
83 -
 84
84 -
 85
85 -
 86
86 -
 87
87 -
 88
88 -
89
-
90
-
91
-
92
-
93
-
94
-
95
-
96
-
97
-
98
-
99
-
100
-
101
-
102
-
103
-
104
-
105
-
106
-
107
-
108
-
109
-
110
-
111
-
112
-
113
-
114
-
115
-
116
-
117
-
118
-
119
-
120
-
121
-
122
-
123
-
124
-
125
-
126
-
127
-
128
-
129
-
130
-
131
-
132
-
133
-
134
-
135
-
136
-
137
-
138
-
139
-
140
-
141
-
142
 |
 |

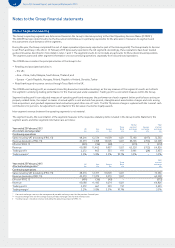
74 Tesco PLC Annual Report and Financial Statements 2013
Group balance sheet
notes
23 February
2013
£m
25 February
2012
£m
Non-current assets
Goodwill and other intangible assets 10 4,362 4,618
Property, plant and equipment 11 24,870 25,710
Investment property 12 2,001 1,991
Investments in joint ventures and associates 13 494 423
Other investments 14 818 1,526
Loans and advances to customers 17 2,465 1,901
Derivative financial instruments 21 1,965 1,726
Deferred tax assets 658 23
37,033 37,918
Current assets
Inventories 15 3,744 3,598
Trade and other receivables 16 2,525 2,657
Loans and advances to customers 17 3,094 2,502
Derivative financial instruments 21 58 41
Current tax assets 10 7
Short-term investments 522 1,243
Cash and cash equivalents 18 2,512 2,305
12,465 12,353
Assets of the disposal group and non-current assets classified as held for sale 7631 510
13,096 12,863
Current liabilities
Trade and other payables 19 (11,094) (11,234)
Financial liabilities:
Borrowings 20 (766) (1,838)
Derivative financial instruments and other liabilities 21 (121) (128)
Customer deposits and deposits by banks 23 (6,015) (5,465)
Current tax liabilities (519) (416)
Provisions 24 (188) (99)
(18,703) (19,180)
Liabilities of the disposal group classified as held for sale 7(282) (69)
Net current liabilities (5,889) (6,386)
Non-current liabilities
Financial liabilities:
Borrowings 20 (10,068) (9,911)
Derivative financial instruments and other liabilities 21 (759) (688)
Post-employment benefit obligations 26 (2,378) (1,872)
Deferred tax liabilities 6(1,006) (1,160)
Provisions 24 (272) (100)
(14,483) (13,731)
Net assets 16,661 17,801
Equity
Share capital 27 403 402
Share premium 5,020 4,964
All other reserves 685 245
Retained earnings 10,535 12,164
Equity attributable to owners of the parent 16,643 17,775
Non-controlling interests 18 26
Total equity 16,661 17,8 01
The notes on pages 77 to 125 form part of these financial statements.
Philip Clarke
Laurie McIlwee
Directors
The financial statements on pages 72 to 125 were authorised for issue by the Directors on 1 May 2013 and are subject to the approval of the
shareholders at the Annual General Meeting on 28 June 2013.