Tesco 2013 Annual Report Download - page 101
Download and view the complete annual report
Please find page 101 of the 2013 Tesco annual report below. You can navigate through the pages in the report by either clicking on the pages listed below, or by using the keyword search tool below to find specific information within the annual report.-
 1
1 -
2
-
3
-
4
-
5
-
6
-
7
-
8
-
9
-
10
-
11
-
12
-
13
-
14
-
15
-
16
-
17
-
18
-
19
-
20
-
21
-
22
-
23
-
24
-
25
-
26
-
27
-
28
-
29
-
30
-
31
-
32
-
33
-
34
-
35
-
36
-
37
-
38
-
39
-
40
-
41
-
42
-
43
-
44
-
45
-
46
-
47
-
48
-
49
-
50
-
51
-
52
-
53
-
54
-
55
-
56
-
57
-
58
-
59
-
60
-
61
-
62
-
63
-
64
-
65
-
66
-
67
-
68
-
69
-
70
-
71
-
72
-
73
-
74
-
75
-
76
-
77
-
78
-
79
-
80
-
81
-
82
-
83
-
84
-
85
-
86
-
87
-
88
-
89
-
90
-
 91
91 -
 92
92 -
 93
93 -
 94
94 -
 95
95 -
 96
96 -
 97
97 -
 98
98 -
 99
99 -
 100
100 -
 101
101 -
 102
102 -
 103
103 -
 104
104 -
 105
105 -
 106
106 -
 107
107 -
 108
108 -
 109
109 -
 110
110 -
 111
111 -
112
-
113
-
114
-
115
-
116
-
117
-
118
-
119
-
120
-
121
-
122
-
123
-
124
-
125
-
126
-
127
-
128
-
129
-
130
-
131
-
132
-
133
-
134
-
135
-
136
-
137
-
138
-
139
-
140
-
141
-
142
 |
 |

97
Tesco PLC Annual Report and Financial Statements 2013
OVERVIEW BUSINESS REVIEW PERFORMANCE REVIEW GOVERNANCE FINANCIAL STATEMENTS
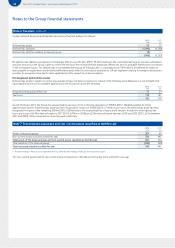
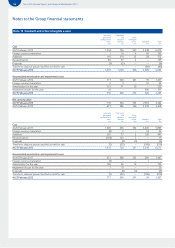
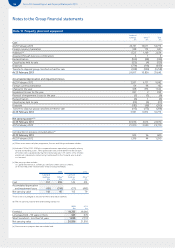
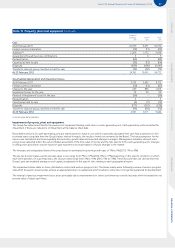
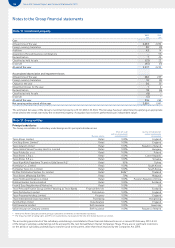
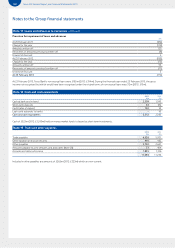
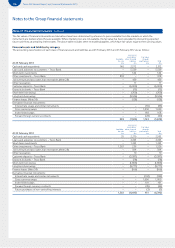
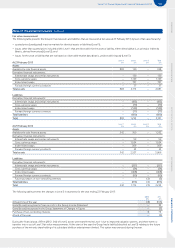
Note 11 Property, plant and equipment continued
Land and
buildings
£m
Other(a)
£m
Total
£m
Cost
At 26 February 2011 23,479 9,091 32,570
Foreign currency translation (14) (11) (25)
Additions(b) 2,286 1,172 3,458
Acquisitions through business combinations 3 6 9
Reclassification (63) – (63)
Classified as held for sale (53) (11) (64)
Disposals (843) (198) (1,041)
Transfer to disposal group classified as held for sale (34) (38) (72)
At 25 February 2012 24,761 10,011 34,772
Accumulated depreciation and impairment losses
At 26 February 2011 2,705 5,467 8,172
Foreign currency translation (10) (11) (21)
Charge for the year 429 836 1,265
Impairment losses for the year 74 25 99
Reversal of impairment losses for the year (36) – (36)
Reclassification 5 – 5
Classified as held for sale (5) (7) (12)
Disposals (177) (161) (338)
Transfer to disposal group classified as held for sale (34) (38) (72)
At 25 February 2012 2,951 6,111 9,062
(a) (b) See page 96 for footnotes.
Impairment of property, plant and equipment
The Group has determined that for the purposes of impairment testing, each store is a cash-generating unit. Cash-generating units are tested for
impairment if there are indications of impairment at the balance sheet date.
Recoverable amounts for cash-generating units are mainly based on value in use, which is generally calculated from cash flow projections for five
to twenty years using data from the Group’s latest internal forecasts, the results of which are reviewed by the Board. The key assumptions for the
value in use calculations are those regarding discount rates, growth rates and expected changes in margins. Management estimates discount rates
using pre-tax rates that reflect the current market assessment of the time value of money and the risks specific to the cash-generating units. Changes
in selling prices and direct costs are based on past experience and expectations of future changes in the market.
The forecasts are extrapolated beyond five years based on estimated long-term growth rates of 1% to 5% (2012: 1% to 5%).
The pre-tax discount rates used to calculate value in use range from 7% to 12% (2012: 6% to 17%) depending on the specific conditions in which
each store operates. On a post-tax basis, the discount rates range from 5% to 10% (2012: 5% to 13%). These discount rates are derived from the
Group’s post-tax weighted average cost of capital, as adjusted for the specific risks relating to each geographical region.
The impairment losses relate to stores, distribution centres and work-in-progress sites. The losses mainly arose following a review of work-in-progress
sites which focused on ensuring sites achieve an appropriate return on capital and which resulted in some sites no longer being planned for development.
The reversal of previous impairment losses arose principally due to improvements in stores’ performances over the last year, which increased the net
present value of future cash flows.