TCF Bank 2004 Annual Report Download - page 59
Download and view the complete annual report
Please find page 59 of the 2004 TCF Bank annual report below. You can navigate through the pages in the report by either clicking on the pages listed below, or by using the keyword search tool below to find specific information within the annual report.-
 1
1 -
2
-
3
-
4
-
5
-
6
-
7
-
8
-
9
-
10
-
11
-
12
-
13
-
14
-
15
-
16
-
17
-
18
-
19
-
20
-
21
-
22
-
23
-
24
-
25
-
26
-
27
-
28
-
29
-
30
-
31
-
32
-
33
-
34
-
35
-
36
-
37
-
38
-
39
-
40
-
41
-
42
-
43
-
44
-
45
-
46
-
47
-
48
-
 49
49 -
 50
50 -
 51
51 -
 52
52 -
 53
53 -
 54
54 -
 55
55 -
 56
56 -
 57
57 -
 58
58 -
 59
59 -
 60
60 -
 61
61 -
 62
62 -
 63
63 -
 64
64 -
 65
65 -
 66
66 -
 67
67 -
 68
68 -
 69
69 -
70
-
71
-
72
-
73
-
74
-
75
-
76
-
77
-
78
-
79
-
80
-
81
-
82
-
83
-
84
-
85
-
86
-
87
-
88
 |
 |

2004 Annual Report 57
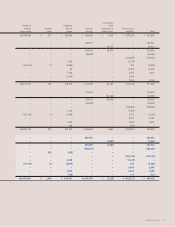
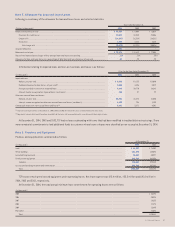
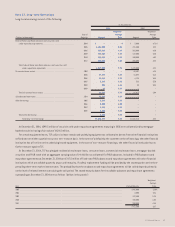
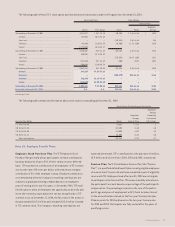
The following table shows the securities available for sale portfolio’s gross unrealized losses and fair value, aggregated by investment
category and length of time that individual securities have been in a continuous unrealized loss position, at December 31, 2004. TCF has
reviewed these securities and has concluded that the unrealized losses are temporary and no impairment has occurred at December 31, 2004.
Less than 12 months 12 months or more Total
Unrealized Unrealized Unrealized
(In thousands) Fair Value Losses Fair Value Losses Fair Value Losses
Mortgage-backed securities:
Federal agencies . . . . . . . . . . . . . . . . . . . . $994,892 $(2,658) $80,659 $(1,376) $1,075,551 $(4,034)
Other . . . . . . . . . . . . . . . . . . . . . . . . . . . . . – – 5,324 (222) 5,324 (222)
Total temporarily impaired securities . . . . . $994,892 $(2,658) $85,983 $(1,598) $1,080,875 $(4,256)
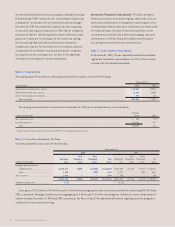
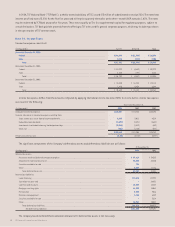
Note 5. Loans Held for Sale
Loans held for sale consist of the following:
At December 31,
(In thousands) 2004 2003
Education loans . . . . . . . . . . . . . . . . . . . . . . . . . . . . . . . . . . . . . . . . . . . . . . . . . . . . . . . . . . . . . . . . . . . . . . . . . . . . . . . . . . . . . . . . . . . . . . . . . . $154,279 $234,337
Residential mortgage loans . . . . . . . . . . . . . . . . . . . . . . . . . . . . . . . . . . . . . . . . . . . . . . . . . . . . . . . . . . . . . . . . . . . . . . . . . . . . . . . . . . . . . –101,035
Total . . . . . . . . . . . . . . . . . . . . . . . . . . . . . . . . . . . . . . . . . . . . . . . . . . . . . . . . . . . . . . . . . . . . . . . . . . . . . . . . . . . . . . . . . . . . . . . . $154,279 $335,372
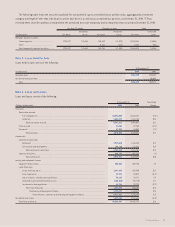
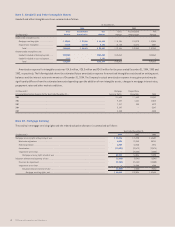
Note 6. Loans and Leases
Loans and leases consist of the following:
At December 31, Percentage
(Dollars in thousands) 2004 2003 Change
Consumer:
Real estate secured:
First mortgage lien . . . . . . . . . . . . . . . . . . . . . . . . . . . . . . . . . . . . . . . . . . . . . . . . . . . . . . . . . . . . . . . . . $2,894,538 $2,446,841 18.3%
Junior lien . . . . . . . . . . . . . . . . . . . . . . . . . . . . . . . . . . . . . . . . . . . . . . . . . . . . . . . . . . . . . . . . . . . . . . . . 1,487,478 1,141,186 30.3
Total real estate secured . . . . . . . . . . . . . . . . . . . . . . . . . . . . . . . . . . . . . . . . . . . . . . . . . . . . . . . . . 4,382,016 3,588,027 22.1
Other secured . . . . . . . . . . . . . . . . . . . . . . . . . . . . . . . . . . . . . . . . . . . . . . . . . . . . . . . . . . . . . . . . . . . . . . . . . . . 22,585 27,265 (17.2)
Unsecured . . . . . . . . . . . . . . . . . . . . . . . . . . . . . . . . . . . . . . . . . . . . . . . . . . . . . . . . . . . . . . . . . . . . . . . . . . . . . . 13,987 15,049 (7.1)
Total consumer . . . . . . . . . . . . . . . . . . . . . . . . . . . . . . . . . . . . . . . . . . . . . . . . . . . . . . . . . . . . . . . . . . 4,418,588 3,630,341 21.7
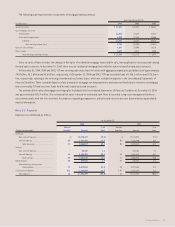
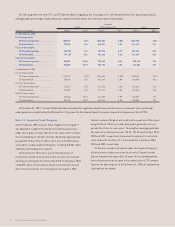
Commercial:
Commercial real estate:
Permanent . . . . . . . . . . . . . . . . . . . . . . . . . . . . . . . . . . . . . . . . . . . . . . . . . . . . . . . . . . . . . . . . . . . . . . . . . . 1,957,676 1,745,435 12.2
Construction and development . . . . . . . . . . . . . . . . . . . . . . . . . . . . . . . . . . . . . . . . . . . . . . . . . . . . . . . . 196,720 171,266 14.9
Total commercial real estate . . . . . . . . . . . . . . . . . . . . . . . . . . . . . . . . . . . . . . . . . . . . . . . . . . . . . . 2,154,396 1,916,701 12.4
Commercial business . . . . . . . . . . . . . . . . . . . . . . . . . . . . . . . . . . . . . . . . . . . . . . . . . . . . . . . . . . . . . . . . . . . 424,135 427,696 (.8)
Total commercial . . . . . . . . . . . . . . . . . . . . . . . . . . . . . . . . . . . . . . . . . . . . . . . . . . . . . . . . . . . . . . . 2,578,531 2,344,397 10.0
Leasing and equipment finance:
Equipment finance loans . . . . . . . . . . . . . . . . . . . . . . . . . . . . . . . . . . . . . . . . . . . . . . . . . . . . . . . . . . . . . . . . 334,352 309,740 7.9
Lease financings:
Direct financing leases . . . . . . . . . . . . . . . . . . . . . . . . . . . . . . . . . . . . . . . . . . . . . . . . . . . . . . . . . . . . . . 1,067,845 853,395 25.1
Sales-type leases . . . . . . . . . . . . . . . . . . . . . . . . . . . . . . . . . . . . . . . . . . . . . . . . . . . . . . . . . . . . . . . . . . 22,742 33,073 (31.2)
Lease residuals, excluding leveraged leases . . . . . . . . . . . . . . . . . . . . . . . . . . . . . . . . . . . . . . . . . . . . . . 35,163 34,171 2.9
Unearned income and deferred lease costs . . . . . . . . . . . . . . . . . . . . . . . . . . . . . . . . . . . . . . . . . . . . . . (103,516) (92,710) 11.7
Investment in leveraged leases . . . . . . . . . . . . . . . . . . . . . . . . . . . . . . . . . . . . . . . . . . . . . . . . . . . . . . . . . . 18,786 22,728 (17.3)
Total lease financings . . . . . . . . . . . . . . . . . . . . . . . . . . . . . . . . . . . . . . . . . . . . . . . . . . . . . . . . . . . . . . . 1,041,020 850,657 22.4
Total leasing and equipment finance . . . . . . . . . . . . . . . . . . . . . . . . . . . . . . . . . . . . . . . . . . . . . . . . 1,375,372 1,160,397 18.5
Total consumer, commercial and leasing and equipment finance . . . . . . . . . . . . . . . . . . . . 8,372,491 7,135,135 17.3
Residential real estate . . . . . . . . . . . . . . . . . . . . . . . . . . . . . . . . . . . . . . . . . . . . . . . . . . . . . . . . . . . . . . . . . . . . . . 1,014,166 1,212,643 (16.4)
Total loans and leases . . . . . . . . . . . . . . . . . . . . . . . . . . . . . . . . . . . . . . . . . . . . . . . . . . . . . . . . . . . . . . . . . . $9,386,657 $8,347,778 12.4