TCF Bank 2004 Annual Report Download - page 58
Download and view the complete annual report
Please find page 58 of the 2004 TCF Bank annual report below. You can navigate through the pages in the report by either clicking on the pages listed below, or by using the keyword search tool below to find specific information within the annual report.-
 1
1 -
2
-
3
-
4
-
5
-
6
-
7
-
8
-
9
-
10
-
11
-
12
-
13
-
14
-
15
-
16
-
17
-
18
-
19
-
20
-
21
-
22
-
23
-
24
-
25
-
26
-
27
-
28
-
29
-
30
-
31
-
32
-
33
-
34
-
35
-
36
-
37
-
38
-
39
-
40
-
41
-
42
-
43
-
44
-
45
-
46
-
47
-
 48
48 -
 49
49 -
 50
50 -
 51
51 -
 52
52 -
 53
53 -
 54
54 -
 55
55 -
 56
56 -
 57
57 -
 58
58 -
 59
59 -
 60
60 -
 61
61 -
 62
62 -
 63
63 -
 64
64 -
 65
65 -
 66
66 -
 67
67 -
 68
68 -
69
-
70
-
71
-
72
-
73
-
74
-
75
-
76
-
77
-
78
-
79
-
80
-
81
-
82
-
83
-
84
-
85
-
86
-
87
-
88
 |
 |

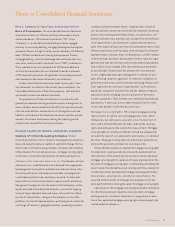
56 TCF Financial Corporation and Subsidiaries
intrinsic value based method of accounting prescribed by Accounting
Principles Board (“APB”) Opinion No. 25, “Accounting for Stock Issued
to Employees,” as amended, for stock-based transactions through
December 31,1999. No compensation expense has been recognized
for any stock option grants made prior to 2000. Had the recognition
provisions of SFAS No. 123 been applied to the pre-2000 stock option
grants, the related pro-forma impact on net income and earnings
per share during 2003 and 2002 would have been immaterial.
Compensation expense for restricted stock is recorded as unearned
compensation in stockholders’ equity and amortized to compensa-
tion expense over the vesting periods. See Note 17 for additional
information concerning stock-based compensation.
Derivative Financial Instruments TCF utilizes derivative
financial instruments to meet the ongoing credit needs of its cus-
tomers and used derivatives to manage the market exposure of its
residential loans held for sale and its commitments to extend credit
for residential loans. Derivative financial instruments include
commitments to extend credit and forward mortgage loan sales
commitments. See Notes 19 and 20 for additional information
concerning these derivative financial instruments.
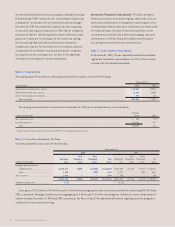
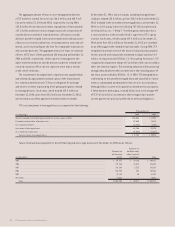
Note 2. Cash and Due from Banks
At December 31, 2004, TCF was required by Federal Reserve Board
regulations to maintain reserve balances of $70.1 million in cash
on hand or at the Federal Reserve Bank.
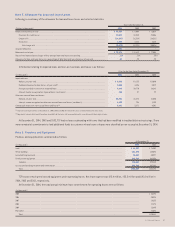
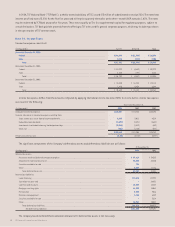
Note 3. Investments
The carrying values of investments, which approximate their fair values, consist of the following:
At December 31,
(In thousands) 2004 2003
Federal Home Loan Bank stock, at cost . . . . . . . . . . . . . . . . . . . . . . . . . . . . . . . . . . . . . . . . . . . . . . . . . . . . . . . . . . . . . . . . . . . . . . . . . $ 80,841 $ 50,411
Federal Reserve Bank stock, at cost . . . . . . . . . . . . . . . . . . . . . . . . . . . . . . . . . . . . . . . . . . . . . . . . . . . . . . . . . . . . . . . . . . . . . . . . . . . . . 21,865 24,045
Interest-bearing deposits with banks . . . . . . . . . . . . . . . . . . . . . . . . . . . . . . . . . . . . . . . . . . . . . . . . . . . . . . . . . . . . . . . . . . . . . . . . . . . . . . . . . . 520 767
Total investments . . . . . . . . . . . . . . . . . . . . . . . . . . . . . . . . . . . . . . . . . . . . . . . . . . . . . . . . . . . . . . . . . . . . . . . . . . . . . . . . . . . . . . $103,226 $ 75,223
The carrying values and yields on investments at December 31, 2004, by contractual maturity, are shown below:
Carrying
(Dollars in thousands) Value Yield
Due in one year or less . . . . . . . . . . . . . . . . . . . . . . . . . . . . . . . . . . . . . . . . . . . . . . . . . . . . . . . . . . . . . . . . . . . . . . . . . . . . . . . . . . . . . . $ 520 1.71%
No stated maturity (1) . . . . . . . . . . . . . . . . . . . . . . . . . . . . . . . . . . . . . . . . . . . . . . . . . . . . . . . . . . . . . . . . . . . . . . . . . . . . . . . . . . . . . . . . 102,706 3.77
Total . . . . . . . . . . . . . . . . . . . . . . . . . . . . . . . . . . . . . . . . . . . . . . . . . . . . . . . . . . . . . . . . . . . . . . . . . . . . . . . . . . . . . . . . . . . . . . . . $103,226 3.76
(1) Balance represents FRB and Federal Home Loan Bank (“FHLB”) stock, required regulatory investments.
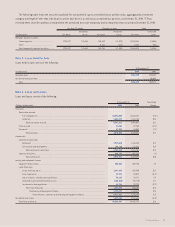
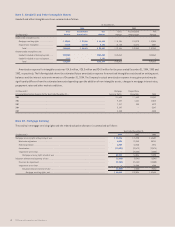
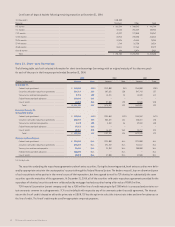
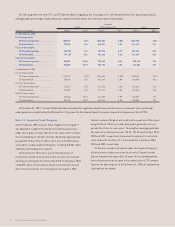
Note 4. Securities Available for Sale
Securities available for sale consist of the following:
At December 31,
2004 2003
Gross Gross Gross Gross
Amortized Unrealized Unrealized Fair Amortized Unrealized Unrealized Fair
(Dollars in thousands) Cost Gains Losses Value Cost Gains Losses Value
Mortgage-backed securities:
Federal agencies . . . . . . . . . . . . . . . . . . . $1,614,513 $2,045 $(4,034) $1,612,524 $1,514,400 $13,744 $(4,677) $1,523,467
Other . . . . . . . . . . . . . . . . . . . . . . . . . . . . . . 6,639 – (222) 6,417 9,272 – (201) 9,071
Other securities . . . . . . . . . . . . . . . . . . . . . 1,000 – – 1,000 750 – – 750
$1,622,152 $2,045 $(4,256) $1,619,941 $1,524,422 $13,744 $(4,878) $1,533,288
Weighted-average yield . . . . . . . . . . . . . . . 5.13% 5.33%
Gross gains of $22.6 million, $32.8 million and $11.5 million were recognized on sales of securities available for sale during 2004, 2003 and
2002, respectively. Mortgage-backed securities aggregating $1.4 billion and $1.3 billion were pledged as collateral to secure certain deposits
and borrowings at December 31, 2004 and 2003, respectively. See Notes 12 and 13 for additional information regarding securities pledged as
collateral to secure certain borrowings.