TCF Bank 2004 Annual Report Download - page 41
Download and view the complete annual report
Please find page 41 of the 2004 TCF Bank annual report below. You can navigate through the pages in the report by either clicking on the pages listed below, or by using the keyword search tool below to find specific information within the annual report.-
 1
1 -
2
-
3
-
4
-
5
-
6
-
7
-
8
-
9
-
10
-
11
-
12
-
13
-
14
-
15
-
16
-
17
-
18
-
19
-
20
-
21
-
22
-
23
-
24
-
25
-
26
-
27
-
28
-
29
-
30
-
 31
31 -
 32
32 -
 33
33 -
 34
34 -
 35
35 -
 36
36 -
 37
37 -
 38
38 -
 39
39 -
 40
40 -
 41
41 -
 42
42 -
 43
43 -
 44
44 -
 45
45 -
 46
46 -
 47
47 -
 48
48 -
 49
49 -
 50
50 -
 51
51 -
52
-
53
-
54
-
55
-
56
-
57
-
58
-
59
-
60
-
61
-
62
-
63
-
64
-
65
-
66
-
67
-
68
-
69
-
70
-
71
-
72
-
73
-
74
-
75
-
76
-
77
-
78
-
79
-
80
-
81
-
82
-
83
-
84
-
85
-
86
-
87
-
88
 |
 |

2004 Annual Report 39
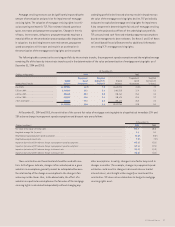
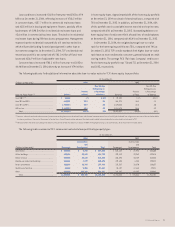
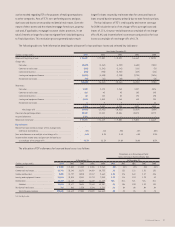
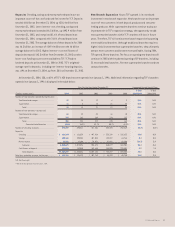
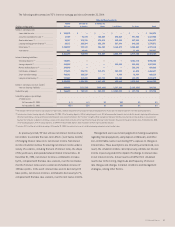
Non-performing assets are summarized in the following table:
At December 31,
(Dollars in thousands) 2004 2003 2002 2001 2000
Non-accrual loans and leases:
Consumer . . . . . . . . . . . . . . . . . . . . . . . . . . . . . . . . . . . . . . . . . . . $12,187 $12,052 $11,163 $16,473 $13,027
Commercial real estate . . . . . . . . . . . . . . . . . . . . . . . . . . . . . . . . 1,093 2,490 3,213 11,135 5,820
Commercial business . . . . . . . . . . . . . . . . . . . . . . . . . . . . . . . . . . 4,533 2,931 4,777 3,550 236
Leasing and equipment finance . . . . . . . . . . . . . . . . . . . . . . . . . . 25,678 13,940 18,689 13,857 11,286
Residential real estate . . . . . . . . . . . . . . . . . . . . . . . . . . . . . . . . 3,387 3,993 5,798 6,959 4,829
Total non-accrual loans and leases . . . . . . . . . . . . . . . . . . . 46,878 35,406 43,640 51,974 35,198
Other real estate owned:
Residential . . . . . . . . . . . . . . . . . . . . . . . . . . . . . . . . . . . . . . . . . 11,726 20,462 16,479 12,830 10,422
Commercial . . . . . . . . . . . . . . . . . . . . . . . . . . . . . . . . . . . . . . . . . . 5,465 12,992 10,093 1,825 447
Total other real estate owned . . . . . . . . . . . . . . . . . . . . . . . . 17,191 33,454 26,572 14,655 10,869
Total non-performing assets . . . . . . . . . . . . . . . . . . . . . . . . $64,069 $68,860 $70,212 $66,629 $46,067
Non-performing assets as a percentage of net loans and leases . . . . .69% .83% .87% .82% .54%
Non-performing assets as a percentage of total assets . . . . . . . . . . .52 .61 .58 .59 .41
Included in non-performing assets are loans that are considered impaired. Impaired loans totaled $8.1 million and $9.1 million at
December 31, 2004 and December 31, 2003, respectively. The related allowance for credit losses was $3.7 million at December 31, 2004,
compared with $4.5 million at December 31, 2003. All of the impaired loans were on non-accrual status. There were no impaired loans at
December 31, 2004 and 2003 which did not have a related allowance for loan losses. The average balance of impaired loans was $9.8 million
for 2004, compared with $10.8 million for 2003.
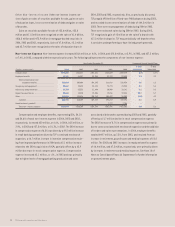
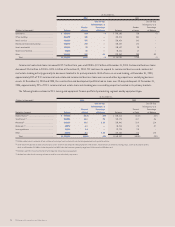
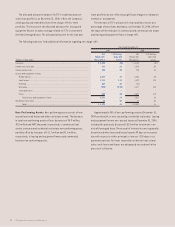
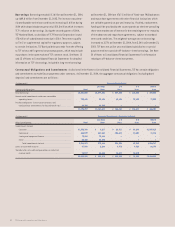
Past Due Loans and Leases The following table sets forth information regarding TCF’s delinquent loan and lease portfolio, excluding loans
held for sale and non-accrual loans and leases. TCF’s delinquency rates are determined using the contractual method.
At December 31,
2004 2003
Percentage of Percentage of
Principal Loans and Principal Loans and
(Dollars in thousands) Balances Leases Balances Leases
Accruing loans and leases delinquent for:
30-59 days . . . . . . . . . . . . . . . . . . . . . . . . . . . . . . . . . . . . . . . . . . . . . . . . . . . . . . . . . . .$20,776 .23% $24,187 .29%
60-89 days . . . . . . . . . . . . . . . . . . . . . . . . . . . . . . . . . . . . . . . . . . . . . . . . . . . . . . . . . . .8,659 .09 8,953 .11
90 days or more . . . . . . . . . . . . . . . . . . . . . . . . . . . . . . . . . . . . . . . . . . . . . . . . . . . . . . 4,950 .05 5,604 .07
Total . . . . . . . . . . . . . . . . . . . . . . . . . . . . . . . . . . . . . . . . . . . . . . . . . . . . . . . . . . . $34,385 .37% $38,744 .47%
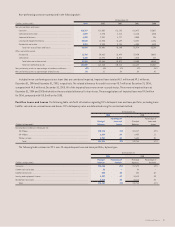
The following table summarizes TCF’s over 30-day delinquent loan and lease portfolio, by loan type:
At December 31,
2004 2003
Principal Percentage of Principal Percentage of
(Dollars in thousands) Balances Portfolio Balances Portfolio
Consumer . . . . . . . . . . . . . . . . . . . . . . . . . . . . . . . . . . . . . . . . . . . . . . . . . . . . . . . . . . . . . . . . . . $15,436 .35 % $17,673 .49%
Commercial real estate . . . . . . . . . . . . . . . . . . . . . . . . . . . . . . . . . . . . . . . . . . . . . . . . . . . . . . . . 32 – 58 –
Commercial business . . . . . . . . . . . . . . . . . . . . . . . . . . . . . . . . . . . . . . . . . . . . . . . . . . . . . . . . . . 404 .10 282 .07
Leasing and equipment finance . . . . . . . . . . . . . . . . . . . . . . . . . . . . . . . . . . . . . . . . . . . . . . . 8,997 .67 10,619 .93
Residential real estate . . . . . . . . . . . . . . . . . . . . . . . . . . . . . . . . . . . . . . . . . . . . . . . . . . . . 9,516 .94 10,112 .84
Total . . . . . . . . . . . . . . . . . . . . . . . . . . . . . . . . . . . . . . . . . . . . . . . . . . . . . . . . . . . . . . . . . $34,385 .37% $38,744 .47%