TCF Bank 2004 Annual Report Download - page 22
Download and view the complete annual report
Please find page 22 of the 2004 TCF Bank annual report below. You can navigate through the pages in the report by either clicking on the pages listed below, or by using the keyword search tool below to find specific information within the annual report.-
 1
1 -
2
-
3
-
4
-
5
-
6
-
7
-
8
-
9
-
10
-
11
-
 12
12 -
 13
13 -
 14
14 -
 15
15 -
 16
16 -
 17
17 -
 18
18 -
 19
19 -
 20
20 -
 21
21 -
 22
22 -
 23
23 -
 24
24 -
 25
25 -
 26
26 -
 27
27 -
 28
28 -
 29
29 -
 30
30 -
 31
31 -
 32
32 -
33
-
34
-
35
-
36
-
37
-
38
-
39
-
40
-
41
-
42
-
43
-
44
-
45
-
46
-
47
-
48
-
49
-
50
-
51
-
52
-
53
-
54
-
55
-
56
-
57
-
58
-
59
-
60
-
61
-
62
-
63
-
64
-
65
-
66
-
67
-
68
-
69
-
70
-
71
-
72
-
73
-
74
-
75
-
76
-
77
-
78
-
79
-
80
-
81
-
82
-
83
-
84
-
85
-
86
-
87
-
88
 |
 |

20 TCF Financial Corporation and Subsidiaries
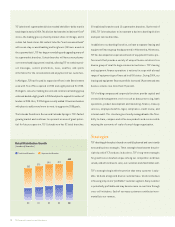
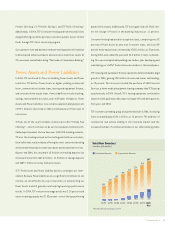
Performance Summary TCF reported diluted earnings per com-
mon share of $1.86 for 2004, compared with $1.53 for 2003 and $1.58
for 2002. Net income was $255 million for 2004, compared with $215.9
million for 2003 and $232.9 million for 2002. Return on average assets
was 2.15% in 2004, compared with 1.85% in 2003 and 2.01% in 2002.
Return on average equity was 27.02% in 2004, compared with 23.05%
in 2003 and 25.38% in 2002. During 2003, TCF prepaid $954 million of
high cost FHLB borrowings, incurring early termination fees of $44.3
million ($29.2 million after-tax) which reduced diluted earnings per
share by 21 cents. There were no debt terminations in 2004 or 2002.
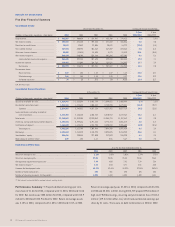
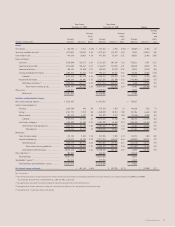
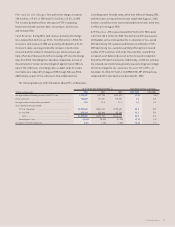
RESULTS OF OPERATIONS
Five Year Financial Summary
Consolidated Income:
Year Ended December 31, Compound Annual Growth Rate
1-Year 5-Year
(Dollars in thousands, except per-share data) 2004 2003 2002 2001 2000 2004/2003 2004/1999
Total revenue . . . . . . . . . . . . . . . . . . . . . . . . . . . $ 982,357 $ 900,424 $ 918,987 $ 852,708 $ 774,812 9.1% 5.9%
Net interest income . . . . . . . . . . . . . . . . . . . . . . $ 491,891 $ 481,145 $ 499,225 $ 481,222 $ 438,536 2.2 3.0
Provision for credit losses . . . . . . . . . . . . . . . . . 10,947 12,532 22,006 20,878 14,772 (12.6) (8.3)
Fees & other revenue . . . . . . . . . . . . . . . . . . . . . 467,866 430,792 406,264 367,307 323,463 8.6 11.3
Other non-interest income . . . . . . . . . . . . . . . . . 22,600 (11,513) 13,498 4,179 12,813 N.M. (10.5)
Non-interest expense . . . . . . . . . . . . . . . . . . . . . 586,934 560,109 539,288 501,996 457,202 4.8 5.6
Income before income tax expense . . . . . . . 384,476 327,783 357,693 329,834 302,838 17.3 7.1
Income tax expense . . . . . . . . . . . . . . . . . . . . . . 129,483 111,905 124,762 122,512 116,593 15.7 3.9
Net income . . . . . . . . . . . . . . . . . . . . . . . . . $ 254,993 $ 215,878 $ 232,931 $ 207,322 $ 186,245 18.1 9.0
Per common share:
Basic earnings . . . . . . . . . . . . . . . . . . . . . . . . $ 1.87 $ 1.53 $ 1.58 $ 1.37 $ 1.18 22.2 13.1
Diluted earnings . . . . . . . . . . . . . . . . . . . . . $ 1.86 $ 1.53 $ 1.58 $ 1.35 $ 1.17 21.6 13.2
Dividends declared . . . . . . . . . . . . . . . . . . . $ .75 $ .65 $ .575 $ .50 $ .4125 15.4 15.7
N.M. Not Meaningful.
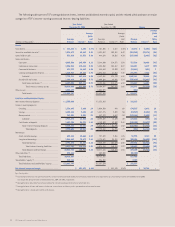
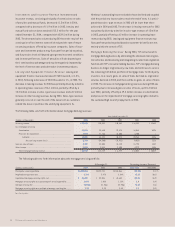
Consolidated Financial Condition:
At December 31, Compound Annual Growth Rate
1-Year 5-Year
(Dollars in thousands, except per-share data) 2004 2003 2002 2001 2000 2004/2003 2004/1999
Securities available for sale . . . . . . . . . . . . . . . . $ 1,619,941 $ 1,533,288 $ 2,426,794 $ 1,584,661 $ 1,403,888 5.7% 1.3%
Residential real estate loans . . . . . . . . . . . . . . . 1,014,166 1,212,643 1,800,344 2,733,290 3,673,831 (16.4) (23.7)
Subtotal . . . . . . . . . . . . . . . . . . . . . . . . . . . 2,634,107 2,745,931 4,227,138 4,317,951 5,077,719 (4.1) (13.5)
Loans and leases excluding residential
real estate loans . . . . . . . . . . . . . . . . . . . . . 8,372,491 7,135,135 6,320,784 5,510,912 4,872,868 17.3 16.1
Total assets . . . . . . . . . . . . . . . . . . . . . . . . . . . . 12,340,567 11,319,015 12,202,069 11,358,715 11,197,462 9.0 3.0
Checking, savings and money market deposits . . 6,493,545 5,999,626 5,791,233 4,778,714 4,086,219 8.2 11.8
Certificates of deposit . . . . . . . . . . . . . . . . . . . . . 1,468,650 1,612,123 1,918,755 2,320,244 2,805,605 (8.9) (12.6)
Total deposits . . . . . . . . . . . . . . . . . . . . . . . 7,962,195 7,611,749 7,709,988 7,098,958 6,891,824 4.6 3.9
Borrowings . . . . . . . . . . . . . . . . . . . . . . . . . . . . . . 3,104,603 2,414,825 3,110,295 3,023,025 3,184,245 28.6 0.1
Stockholders’ equity . . . . . . . . . . . . . . . . . . . . . 958,418 920,858 977,020 917,033 910,220 4.1 3.4
Book value per common share . . . . . . . . . . . . . . 6.99 6.53 6.61 5.96 5.67 7.0 7.2
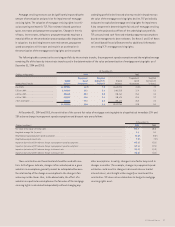
Key Ratios and Other Data:
At or For the Year Ended December 31,
2004 2003 2002 2001 2000
Return on average assets . . . . . . . . . . . . . . . . . . . . . . . . . . . . . . . . . . . . . . . . . . . . . . . . . . . . . . 2.15% 1.85% 2.01% 1.79% 1.72%
Return on average equity . . . . . . . . . . . . . . . . . . . . . . . . . . . . . . . . . . . . . . . . . . . . . . . . . 27.02 23.05 25.38 23.06 22.64
Average total equity to average assets . . . . . . . . . . . . . . . . . . . . . . . . . . . . . . . . . . . . . 7.94 8.03 7.91 7.78 7.58
Net interest margin(1) . . . . . . . . . . . . . . . . . . . . . . . . . . . . . . . . . . . . . . . . . . . . . . . . . . . . . . . . 4.54 4.54 4.71 4.51 4.35
Common dividend payout ratio . . . . . . . . . . . . . . . . . . . . . . . . . . . . . . . . . . . . . . . . . . . . 40.32% 42.48% 36.39% 37.04% 35.26%
Number of banking locations . . . . . . . . . . . . . . . . . . . . . . . . . . . . . . . . . . . . . . . . . . . . 430 401 395 375 352
Number of checking accounts (in thousands) . . . . . . . . . . . . . . . . . . . . . . . . . . . . . . . 1,535 1,444 1,338 1,249 1,131
(1) Net interest income divided by average interest-earning assets.