TCF Bank 2004 Annual Report Download - page 30
Download and view the complete annual report
Please find page 30 of the 2004 TCF Bank annual report below. You can navigate through the pages in the report by either clicking on the pages listed below, or by using the keyword search tool below to find specific information within the annual report.-
 1
1 -
2
-
3
-
4
-
5
-
6
-
7
-
8
-
9
-
10
-
11
-
12
-
13
-
14
-
15
-
16
-
17
-
18
-
19
-
 20
20 -
 21
21 -
 22
22 -
 23
23 -
 24
24 -
 25
25 -
 26
26 -
 27
27 -
 28
28 -
 29
29 -
 30
30 -
 31
31 -
 32
32 -
 33
33 -
 34
34 -
 35
35 -
 36
36 -
 37
37 -
 38
38 -
 39
39 -
 40
40 -
41
-
42
-
43
-
44
-
45
-
46
-
47
-
48
-
49
-
50
-
51
-
52
-
53
-
54
-
55
-
56
-
57
-
58
-
59
-
60
-
61
-
62
-
63
-
64
-
65
-
66
-
67
-
68
-
69
-
70
-
71
-
72
-
73
-
74
-
75
-
76
-
77
-
78
-
79
-
80
-
81
-
82
-
83
-
84
-
85
-
86
-
87
-
88
 |
 |

28 TCF Financial Corporation and Subsidiaries
Investments and Insurance Revenue Investments and
insurance revenue, consisting principally of commissions on sales
of annuities and mutual funds, decreased $1.3 million in 2004,
compared with a decrease of $1.9 million in 2003. Annuity and
mutual fund sales volumes totaled $212.2 million for the year
ended December 31, 2004, compared with $239.5 million during
2003. The decreased sales volumes during 2004 were the result of the
continuation of low interest rates which reduced the rate of return
on annuity products offered by insurance companies. Sales of insur-
ance and investment products may fluctuate from period to period,
and future sales levels will depend upon general economic conditions
and investor preferences. Sales of annuities will also depend upon
their continued tax advantage and may be negatively impacted by
the level of interest rates and alternative investment products.
Leasing and Equipment Finance Revenue Leasing and
equipment finance revenues decreased $765 thousand, or 1.5%,
in 2004, following a decrease of $540 thousand or 1%, in 2003. The
decrease in leasing revenues for 2004 was primarily driven by a decline
in operating lease revenues of $6.1 million, partially offset by a
$3.3 million increase in sales-type lease revenues and a $2 million
increase in other leasing revenues during 2004. Sales-type revenues
generally occur at or near the end of the lease term as customers
extend the lease or purchase the underlying equipment. As
Winthrop’s outstanding lease receivables have declined and coupled
with the period new leases take to reach the end of term, it is antici-
pated that sales-type revenues in 2005 will be lower than those
achieved in 2004 and 2003. The decrease in leasing revenues for 2003
was primarily driven by a decline in sales-type revenues of $3 million
in 2003, partially offset by a $2 million increase in operating lease
revenues during 2003. Leasing and equipment finance revenues may
fluctuate from period to period based on customer-driven factors not
entirely within the control of TCF.
Mortgage Banking Revenue During 2004, TCF restructured its
mortgage banking business by eliminating the wholesale loan origina-
tion activities and downsizing and integrating its retail loan origination
function with TCF’s consumer lending business. TCF’s mortgage banking
business no longer originates any new loans and continues to service
the remaining $4.5 billion portfolio of mortgage loans for third party
investors. As a result, gains on sales of loans declined as origination
volumes declined in 2004, and there will be no gains on sales of loans
in 2005. The increase in mortgage banking revenues during 2003 was
primarily due to increased gains on sales of loans, up $15.4 million
over 2002, partially offset by a $9.5 million increase in amortization
and provision for impairment of mortgage servicing rights related to
the sustained high level of prepayments in 2003.
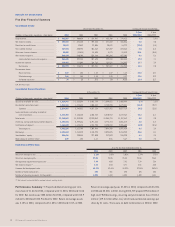
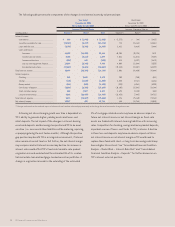
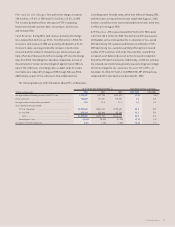
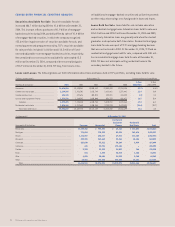
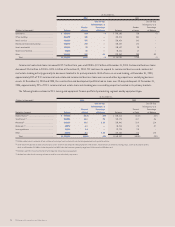
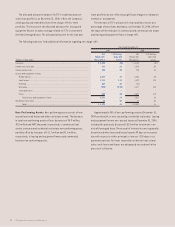
The following table sets forth information about mortgage banking revenues:
Year Ended December 31,
(Dollars in thousands) 2004 2003 2002 2001 2000
Servicing income . . . . . . . . . . . . . . . . . . . . . . . . . . . . . . . . . . . . . . . . $ 17,349 $ 20,533 $ 20,443 $ 16,932 $ 12,642
Less mortgage servicing:
Amortization . . . . . . . . . . . . . . . . . . . . . . . . . . . . . . . . . . . . . . . . . . 13,091 23,680 22,874 16,564 5,326
Provision for impairment . . . . . . . . . . . . . . . . . . . . . . . . . . . . . . . . . 1,500 21,153 12,500 4,400 –
Subtotal . . . . . . . . . . . . . . . . . . . . . . . . . . . . . . . . . . . . . . . . . . . 14,591 44,833 35,374 20,964 5,326
Net servicing income (loss) . . . . . . . . . . . . . . . . . . . . . . 2,758 (24,300) (14,931) (4,032) 7,316
Gains on sales of loans . . . . . . . . . . . . . . . . . . . . . . . . . . . . . . . . . . . . 8,107 33,505 18,110 11,795 1,347
Other income . . . . . . . . . . . . . . . . . . . . . . . . . . . . . . . . . . . . . . . . . . . . . . . . . . 2,095 3,514 3,800 4,279 1,856
Total mortgage banking revenue . . . . . . . . . . . . . . . . . . . . . . . . . . . . $ 12,960 $ 12,719 $ 6,979 $ 12,042 $ 10,519
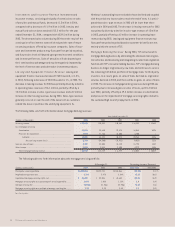
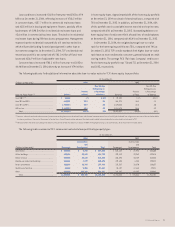
The following table sets forth information about the mortgage servicing portfolio:
At December 31, Percentage Increase (Decrease)
(Dollars in thousands) 2004 2003 2002 2004/2003 2003/2002
Third party servicing portfolio . . . . . . . . . . . . . . . . . . . . . . . . . . . . . . $4,503,564 $5,122,741 $5,576,066 (12.1)% (8.1)%
Weighted average note rate . . . . . . . . . . . . . . . . . . . . . . . . . . . . . . . . . 5.78% 5.97% 6.64% (3.2) (10.1)
Capitalized mortgage servicing rights, net . . . . . . . . . . . . . . . . . . . . . $ 46,442 $ 52,036 $ 62,644 (10.8) (16.9)
Mortgage servicing rights as a percentage of servicing portfolio . . . . 1.03% 1.02% 1.12% 1.0 (8.9)
Average servicing fee . . . . . . . . . . . . . . . . . . . . . . . . . . . . . . . . . . . . . . 31.0bps 31.7bps 32.9bps (2.2) (3.6)
Mortgage servicing rights as a multiple of average servicing fee . . . . 3.3X 3.2X 3.4X 3.1 (5.9)
bps = basis points.