TCF Bank 2004 Annual Report Download - page 54
Download and view the complete annual report
Please find page 54 of the 2004 TCF Bank annual report below. You can navigate through the pages in the report by either clicking on the pages listed below, or by using the keyword search tool below to find specific information within the annual report.-
 1
1 -
2
-
3
-
4
-
5
-
6
-
7
-
8
-
9
-
10
-
11
-
12
-
13
-
14
-
15
-
16
-
17
-
18
-
19
-
20
-
21
-
22
-
23
-
24
-
25
-
26
-
27
-
28
-
29
-
30
-
31
-
32
-
33
-
34
-
35
-
36
-
37
-
38
-
39
-
40
-
41
-
42
-
43
-
 44
44 -
 45
45 -
 46
46 -
 47
47 -
 48
48 -
 49
49 -
 50
50 -
 51
51 -
 52
52 -
 53
53 -
 54
54 -
 55
55 -
 56
56 -
 57
57 -
 58
58 -
 59
59 -
 60
60 -
 61
61 -
 62
62 -
 63
63 -
 64
64 -
65
-
66
-
67
-
68
-
69
-
70
-
71
-
72
-
73
-
74
-
75
-
76
-
77
-
78
-
79
-
80
-
81
-
82
-
83
-
84
-
85
-
86
-
87
-
88
 |
 |

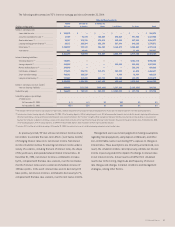
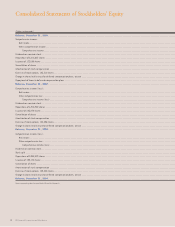
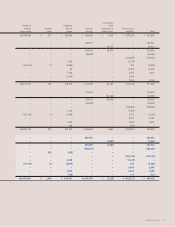
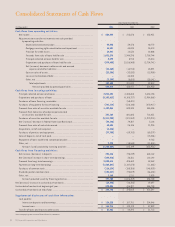
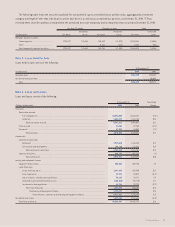
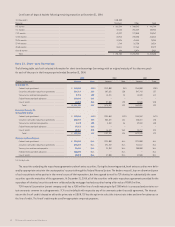
Consolidated Statements of Cash Flows
52 TCF Financial Corporation and Subsidiaries
Year Ended December 31,
(In thousands) 2004 2003 2002
Cash flows from operating activities:
Net income . . . . . . . . . . . . . . . . . . . . . . . . . . . . . . . . . . . . . . . . . . . . . . . . . . . . . $ 254,993 $ 215,878 $ 232,931
Adjustments to reconcile net income to net cash provided
by operating activities:
Depreciation and amortization . . . . . . . . . . . . . . . . . . . . . . . . . . . . . . . . . . 39,996 39,478 40,772
Mortgage servicing rights amortization and impairment . . . . . . . . . . . . . 14,591 44,833 35,374
Provision for credit losses . . . . . . . . . . . . . . . . . . . . . . . . . . . . . . . . . . . . . . . 10,947 12,532 22,006
Proceeds from sales of loans held for sale . . . . . . . . . . . . . . . . . . . . . . . . 1,051,276 2,944,298 2,703,744
Principal collected on loans held for sale . . . . . . . . . . . . . . . . . . . . . . . . . . . 8,090 8,913 15,814
Originations and purchases of loans held for sale . . . . . . . . . . . . . . . . . . . (879,450) (2,816,960) (2,734,741)
Net (increase) decrease in other assets and accrued
expenses and other liabilities . . . . . . . . . . . . . . . . . . . . . . . . . . . . . . . . (31,265) (14,913) 43,091
Gains on sales of assets . . . . . . . . . . . . . . . . . . . . . . . . . . . . . . . . . . . . . . . (23,306) (32,832) (13,900)
Losses on termination of debt . . . . . . . . . . . . . . . . . . . . . . . . . . . . . . . . . –44,345 –
Other, net . . . . . . . . . . . . . . . . . . . . . . . . . . . . . . . . . . . . . . . . . . . . . . . . . . (3,299) (8,655) (20,141)
Total adjustments . . . . . . . . . . . . . . . . . . . . . . . . . . . . . . . . . . . . . . . 187,580 221,039 92,019
Net cash provided by operating activities . . . . . . . . . . . . . . . . . . . 442,573 436,917 324,950
Cash flows from investing activities:
Principal collected on loans and leases . . . . . . . . . . . . . . . . . . . . . . . . . . . . . . . . 3,833,653 4,343,655 3,434,153
Originations and purchases of loans . . . . . . . . . . . . . . . . . . . . . . . . . . . . . . . . . . . . (4,183,611) (4,108,727) (2,984,568)
Purchases of lease financing receivables . . . . . . . . . . . . . . . . . . . . . . . . . . . . . . . . –(58,421) –
Purchases of equipment for lease financing . . . . . . . . . . . . . . . . . . . . . . . . . . . . . . . (703,712) (510,140) (470,917)
Proceeds from sales of securities available for sale . . . . . . . . . . . . . . . . . . . . . . . 1,437,066 849,333 485,406
Proceeds from maturities of and principal collected
on securities available for sale . . . . . . . . . . . . . . . . . . . . . . . . . . . . . . . . . . . 347,304 881,885 718,431
Purchases of securities available for sale . . . . . . . . . . . . . . . . . . . . . . . . . . . . . . . (1,911,905) (871,559) (1,973,974)
Net (increase) decrease in Federal Home Loan Bank stock . . . . . . . . . . . . . . . . . (30,142) 79,307 3,126
Proceeds from sales of real estate owned . . . . . . . . . . . . . . . . . . . . . . . . . . . . . . . 40,654 26,186 21,926
Acquisitions, net of cash acquired . . . . . . . . . . . . . . . . . . . . . . . . . . . . . . . . . . . . (4,326) ––
Purchases of premises and equipment . . . . . . . . . . . . . . . . . . . . . . . . . . . . . . . . . (77,788) (69,782) (60,279)
Sales of deposits, net of cash paid . . . . . . . . . . . . . . . . . . . . . . . . . . . . . . . . . . . –– (15,206)
Repayment of loans to deferred compensation plans . . . . . . . . . . . . . . . . . . . . . –– 9,783
Other, net . . . . . . . . . . . . . . . . . . . . . . . . . . . . . . . . . . . . . . . . . . . . . . . . . . . . . . 2,278 (18,538) (21,834)
Net cash (used) provided by investing activities . . . . . . . . . . . . . . . . . . . . . . (1,250,529) 543,199 (853,953)
Cash flows from financing activities:
Net increase (decrease) in deposits . . . . . . . . . . . . . . . . . . . . . . . . . . . . . . . . . . 350,446 (98,239) 628,142
Net (decrease) increase in short-term borrowings . . . . . . . . . . . . . . . . . . . . . . . . (629,510) 36,361 122,192
Proceeds from long-term borrowings . . . . . . . . . . . . . . . . . . . . . . . . . . . . . . . . . . 2,800,614 425,469 52,462
Payments on long-term borrowings . . . . . . . . . . . . . . . . . . . . . . . . . . . . . . . . . . . . (1,505,847) (1,147,876) (11,665)
Purchases of common stock . . . . . . . . . . . . . . . . . . . . . . . . . . . . . . . . . . . . . . . . . (116,134) (150,356) (148,030)
Dividends paid on common stock . . . . . . . . . . . . . . . . . . . . . . . . . . . . . . . . . . . . . (104,037) (93,029) (86,430)
Other, net . . . . . . . . . . . . . . . . . . . . . . . . . . . . . . . . . . . . . . . . . . . . . . . . . . . . . . 2,168 1,211 2,029
Net cash provided (used) by financing activities . . . . . . . . . . . . . . . . . . . . . . 797,700 (1,026,459) 558,700
Net (decrease) increase in cash and due from banks . . . . . . . . . . . . . . . . . . . . . . . . . (10,256) (46,343) 29,697
Cash and due from banks at beginning of year . . . . . . . . . . . . . . . . . . . . . . . . . . . . . . . 370,054 416,397 386,700
Cash and due from banks at end of year . . . . . . . . . . . . . . . . . . . . . . . . . . . . . . . . . . $ 359,798 $ 370,054 $ 416,397
Supplemental disclosures of cash flow information:
Cash paid for:
Interest on deposits and borrowings . . . . . . . . . . . . . . . . . . . . . . . . . . . . . . . $ 126,228 $ 157,751 $ 234,046
Income taxes . . . . . . . . . . . . . . . . . . . . . . . . . . . . . . . . . . . . . . . . . . . . . . . . . . . . . . . . $ 145,716 $ 139,120 $ 87,899
Transfer of loans and leases to other assets . . . . . . . . . . . . . . . . . . . . . . . . . . . . $ 23,963 $ 44,292 $ 51,713
See accompanying notes to consolidated financial statements.