Suzuki 2012 Annual Report Download - page 7
Download and view the complete annual report
Please find page 7 of the 2012 Suzuki annual report below. You can navigate through the pages in the report by either clicking on the pages listed below, or by using the keyword search tool below to find specific information within the annual report.-
 1
1 -
 2
2 -
 3
3 -
 4
4 -
 5
5 -
 6
6 -
 7
7 -
 8
8 -
 9
9 -
 10
10 -
 11
11 -
 12
12 -
 13
13 -
 14
14 -
 15
15 -
 16
16 -
 17
17 -
 18
18 -
19
-
20
-
21
-
22
-
23
-
24
-
25
-
26
-
27
-
28
-
29
-
30
-
31
-
32
-
33
-
34
-
35
-
36
-
37
-
38
-
39
-
40
-
41
-
42
-
43
-
44
-
45
-
46
-
47
-
48
-
49
-
50
-
51
-
52
-
53
-
54
-
55
-
56
-
57
-
58
-
59
-
60
-
61
-
62
-
63
-
64
-
65
-
66
-
67
-
68
 |
 |

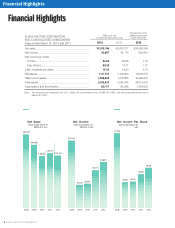
SUZUKI MOTOR CORPORATION 5
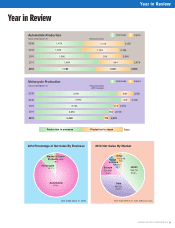
Year in Review
2012 Percentage of Net Sales By Business
2012 Net Sales By Market
(Year ended March 31, 2012) (Year ended March 31, 2012, Millions of yen)
Automobile Production
Years ended March 31 (Thousand units)
Overseas Japan
Motorcycle Production
Years ended March 31 (Thousand units)
(ATV included)
2012 2,400 174 2,574
Overseas Japan
Total
Production in overseas Production in Japan
Automobile
87.9%
Marine & Power
Products, etc.
1.9%
Motorcycle
10.1% Japan
986,774
39.3%
Other
182,938
7.3%
North
America
105,310
4.2%
Europe
350,860
14.0%
Asia
886,301
35.3%
2012 1,782 1,020 2,802
2010 1,586
1,418
959
1,219
2008
2009
2,545
2011 1,884 994 2,878
2,637
1,355 1,139 2,494
2010 2,743
2,841
162
549
2008
2009
2,904
2011 2,550 185 2,735
3,391
2,993 312 3,305