Suzuki 2012 Annual Report Download - page 39
Download and view the complete annual report
Please find page 39 of the 2012 Suzuki annual report below. You can navigate through the pages in the report by either clicking on the pages listed below, or by using the keyword search tool below to find specific information within the annual report.-
 1
1 -
2
-
3
-
4
-
5
-
6
-
7
-
8
-
9
-
10
-
11
-
12
-
13
-
14
-
15
-
16
-
17
-
18
-
19
-
20
-
21
-
22
-
23
-
24
-
25
-
26
-
27
-
28
-
 29
29 -
 30
30 -
 31
31 -
 32
32 -
 33
33 -
 34
34 -
 35
35 -
 36
36 -
 37
37 -
 38
38 -
 39
39 -
 40
40 -
 41
41 -
 42
42 -
 43
43 -
 44
44 -
 45
45 -
 46
46 -
 47
47 -
 48
48 -
 49
49 -
50
-
51
-
52
-
53
-
54
-
55
-
56
-
57
-
58
-
59
-
60
-
61
-
62
-
63
-
64
-
65
-
66
-
67
-
68
 |
 |

Consolidated Financial Statements
SUZUKI MOTOR CORPORATION 37
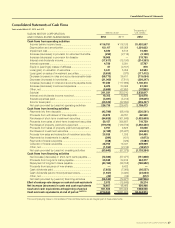
Consolidated Statements of Cash Flows
Years ended March 31, 2012 and 2011
SUZUKI MOTOR CORPORATION
AND CONSOLIDATED SUBSIDIARIES
Millions of yen
Thousands of
U.S. dollars
2012 2011 2012
Cash flows from operating activities
Income before income taxes ............................................. ¥116,751 ¥118,186 $1,420,507
Depreciation and amortization .......................................... 103,117 138,368 1,254,622
Impairment loss ................................................................. 6,030 8,513 73,366
Increase (decrease) in provision for retirement benefits .. (255) (2,114) (3,108)
Increase (decrease) in provision for disaster 18,065 —219,795
Interest and dividends income .......................................... (17,617) (15,190) (214,353)
Interest expenses .............................................................. 4,750 5,091 57,797
Equity in (earnings) losses of affiliates .............................. 67 (4,161) 816
Loss (gain) on valuation of securities ............................... 5,341 5,356 64,983
Loss (gain) on sales of investment securities ................... (9,650) (370) (117,412)
Decrease (increase) in notes and accounts receivable-trade
(58,773) 36,411 (715,094)
Decrease (increase) in inventories ................................... (21,060) (7,811) (256,247)
Increase (decrease) in notes and accounts payable-trade
97,280 (117,986) 1,183,610
Increase (decrease) in accrued expenses ...................... 6,676 23,365 81,230
Other, net ............................................................................ (9,689) 62,650 (117,895)
Subtotal 241,031 250,310 2,932,617
Interest and dividends income received .......................... 19,312 13,822 234,978
Interest expenses paid ...................................................... (4,081) (5,012) (49,665)
Income taxes paid ............................................................. (29,543) (32,650) (359,457)
Net cash provided by (used in) operating activities 226,718 226,470 2,758,473
Cash flows from investing activities
Payments into time deposits ............................................. (42,786) (88,169) (520,581)
Proceeds from withdrawal of time deposits...................... 40,875 49,791 497,328
Purchases of short-term investment securities ................ (84,628) (301,849) (1,029,669)
Proceeds from sales of short-term investment securities
59,157 386,687 719,759
Purchases of property, plant and equipment ................... (119,210) (129,732) (1,450,420)
Proceeds from sales of property, plant and equipment ... 3,751 6,823 45,638
Purchases of investment securities .................................. (2,188) (25,227) (26,633)
Proceeds from sales and redemption of investment securities
. 25,025 1,038 304,480
Payments for investments in capital ................................. (384) (431) (4,673)
Payments of loans receivable ........................................... (458) (326) (5,580)
Collection of loans receivable ........................................... 28,759 16,331 349,909
Other, net ............................................................................ (1,554) (2,314) (18,912)
Net cash provided by (used in) investing activities (93,643) (87,379) (1,139,354)
Cash flows from financing activities
Net increase (decrease) in short-term loans payable ...... (12,480) (57,077) (151,848)
Proceeds from long-term loans payable .......................... 29,948 24,616 364,377
Repayment of long-term loans payable ........................... (64,165) (38,158) (780,692)
Proceeds from issuance of new shares ............................ —6,423 —
Cash dividends paid ......................................................... (7,853) (7,266) (95,557)
Cash dividends paid to minority shareholders ................. (1,947) (3,480) (23,693)
Other, net ............................................................................ (42) (34) (512)
Net cash provided by (used in) financing activities (56,540) (74,977) (687,926)
Effect of exchange rate changes on cash and cash equivalents
2,072 (15,646) 25,214
Net increase (decrease) in cash and cash equivalents 78,607 48,466 956,406
Cash and cash equivalents at beginning of period 631,923 583,456 7,688,568
Cash and cash equivalents at end of period *NOTE 10 ¥710,530 ¥631,923 $8,644,974
The accompanying Notes to Consolidated Financial Statements are an integral part of these statements.