Suzuki 2012 Annual Report Download - page 66
Download and view the complete annual report
Please find page 66 of the 2012 Suzuki annual report below. You can navigate through the pages in the report by either clicking on the pages listed below, or by using the keyword search tool below to find specific information within the annual report.-
 1
1 -
2
-
3
-
4
-
5
-
6
-
7
-
8
-
9
-
10
-
11
-
12
-
13
-
14
-
15
-
16
-
17
-
18
-
19
-
20
-
21
-
22
-
23
-
24
-
25
-
26
-
27
-
28
-
29
-
30
-
31
-
32
-
33
-
34
-
35
-
36
-
37
-
38
-
39
-
40
-
41
-
42
-
43
-
44
-
45
-
46
-
47
-
48
-
49
-
50
-
51
-
52
-
53
-
54
-
55
-
 56
56 -
 57
57 -
 58
58 -
 59
59 -
 60
60 -
 61
61 -
 62
62 -
 63
63 -
 64
64 -
 65
65 -
 66
66 -
 67
67 -
 68
68
 |
 |

64 SUZUKI MOTOR CORPORATION
Non-Consolidated Financial Statements
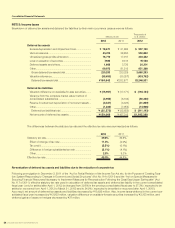
Millions of yen
Thousands of
U.S. dollars
2012 2011 2012
LIABILITIES AND NET ASSETS
Current liabilities:
Short-term loans payable .................................................. ¥131,438 ¥151,787 $1,599,196
Payables:
Accounts payable-trade ................................................ 273,962 223,704 3,333,282
Subsidiaries and affiliates .............................................. 15,383 11,270 187,171
Current portion of long-term dept ..................................... 18,475 24,043 224,784
Current portion of bonds with subscription rights
to shares ............................................................................ 149,975 —1,824,735
Accrued expenses ............................................................ 83,897 79,424 1,020,781
Income taxes payable ....................................................... 6,943 765 84,478
Other ................................................................................... 140,939 110,219 1,714,800
Total current liabilities 821,014 601,215 9,989,230
Noncurrent liabilities:
Long-term loans payable .................................................. 30,800 52,046 374,741
Bonds with subscription rights to shares .......................... —149,975 —
Provision for retirement benefits ........................................ 11,261 10,903 137,017
Provision for directors’ retirement benefits ........................ 1,331 1,410 16,196
Provision for disaster ......................................................... 12,806 —155,809
Other ................................................................................... 17,396 17,473 211,667
Total noncurrent liabilities 73,595 231,809 895,432
Total liabilities 894,610 833,025 10,884,662
Net assets:
Shareholders’ equity:
Capital stock:
Common stock
Authorized - 1,500,000,000 shares
Issued,
as of March 31, 2012 – 561,047,304 ......................... 138,014 —1,679,215
as of March 31, 2011 – 561,047,304 ......................... —138,014 —
Capital surplus ............................................................... 144,364 144,364 1,756,475
Retained earnings .......................................................... 392,343 384,351 4,773,613
Treasury stock ................................................................ (38) (35) (470)
Total shareholders’ equity .......................................... 674,684 666,694 8,208,835
Valuation and translation adjustments:
Valuation difference on available-for-sale securities ..... 29,287 25,354 356,342
Deferred gains or losses on hedges ............................. (679) (841) (8,263)
Total valuation and translation adjustments 28,608 24,512 348,078
Total net assets ¥ 703,292 ¥ 691,207 $ 8,556,913
Total liabilities and net assets ¥1,597,903 ¥1,524,232 $19,441,576