Suzuki 2012 Annual Report Download - page 35
Download and view the complete annual report
Please find page 35 of the 2012 Suzuki annual report below. You can navigate through the pages in the report by either clicking on the pages listed below, or by using the keyword search tool below to find specific information within the annual report.-
 1
1 -
2
-
3
-
4
-
5
-
6
-
7
-
8
-
9
-
10
-
11
-
12
-
13
-
14
-
15
-
16
-
17
-
18
-
19
-
20
-
21
-
22
-
23
-
24
-
 25
25 -
 26
26 -
 27
27 -
 28
28 -
 29
29 -
 30
30 -
 31
31 -
 32
32 -
 33
33 -
 34
34 -
 35
35 -
 36
36 -
 37
37 -
 38
38 -
 39
39 -
 40
40 -
 41
41 -
 42
42 -
 43
43 -
 44
44 -
 45
45 -
46
-
47
-
48
-
49
-
50
-
51
-
52
-
53
-
54
-
55
-
56
-
57
-
58
-
59
-
60
-
61
-
62
-
63
-
64
-
65
-
66
-
67
-
68
 |
 |

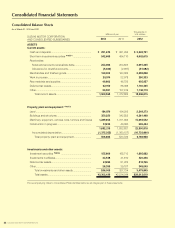
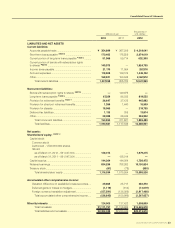
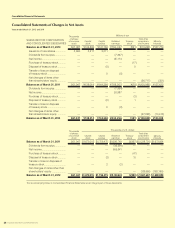
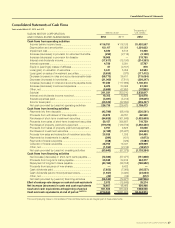
Consolidated Financial Statements
SUZUKI MOTOR CORPORATION 33
Millions of yen
Thousands of
U.S. dollars
2012 2011 2012
LIABILITIES AND NET ASSETS
Current liabilities:
Accounts payable-trade .................................................... ¥ 354,899 ¥ 267,209 $ 4,318,041
Short-term loans payable *NOTE 5 ...................................... 170,463 178,559 2,074,019
Current portion of long term loans payable *NOTE 5 .......... 51,968 59,714 632,300
Current portion of bonds with subscription rights
to shares *NOTE 5 ................................................................. 149,975 —1,824,735
Income taxes payable ....................................................... 21,170 11,064 257,578
Accrued expenses ............................................................ 118,608 139,129 1,443,102
Other ................................................................................... 169,941 150,045 2,067,672
Total current liabilities ................................................. 1,037,028 805,723 12,617,450
Noncurrent liabilities:
Bonds with subscription rights to shares *NOTE 5 .............. —149,975 —
Long-term loans payable *NOTE 5 ....................................... 67,359 96,333 819,555
Provision for retirement benefits *NOTE 7 ............................ 36,647 37,122 445,882
Provision for directors’ retirement benefits ........................ 1,356 1,440 16,509
Provision for disaster ......................................................... 18,065 —219,795
Deferred tax liabilities ........................................................ 1,135 305 13,814
Other ................................................................................... 29,089 26,444 353,932
Total noncurrent liabilities ........................................... 153,653 311,621 1,869,490
Total liabilities .............................................................. 1,190,681 1,117,345 14,486,941
Net assets:
Shareholders’ equity: *NOTE 12
Capital stock:
Common stock
Authorized - 1,500,000,000 shares
Issued,
as of March 31, 2012 – 561,047,304 ......................... 138,014 —1,679,215
as of March 31, 2011 – 561,047,304 ......................... —138,014 —
Capital surplus ................................................................... 144,364 144,364 1,756,475
Retained earnings ............................................................. 834,296 788,263 10,150,824
Treasury stock .................................................................... (81) (78) (990)
Total shareholders’ equity .......................................... 1,116,594 1,070,564 13,585,526
Accumulated other comprehensive income:
Valuation difference on available-for-sale securities ..... 29,865 25,717 363,370
Deferred gains or losses on hedges ............................. (1,119) (614) (13,619)
Foreign currency translation adjustment ....................... (157,591) (126,089) (1,917,408)
Total accumulated other comprehensive income ..... (128,845) (100,986) (1,567,657)
Minority interests ................................................................ 124,009 137,422 1,508,809
Total net assets ¥1,111,757 ¥1,106,999 $13,526,678
Total liabilities and net assets ..................................... ¥2,302,439 ¥2,224,344 $28,013,619