Suzuki 2012 Annual Report Download - page 56
Download and view the complete annual report
Please find page 56 of the 2012 Suzuki annual report below. You can navigate through the pages in the report by either clicking on the pages listed below, or by using the keyword search tool below to find specific information within the annual report.-
 1
1 -
2
-
3
-
4
-
5
-
6
-
7
-
8
-
9
-
10
-
11
-
12
-
13
-
14
-
15
-
16
-
17
-
18
-
19
-
20
-
21
-
22
-
23
-
24
-
25
-
26
-
27
-
28
-
29
-
30
-
31
-
32
-
33
-
34
-
35
-
36
-
37
-
38
-
39
-
40
-
41
-
42
-
43
-
44
-
45
-
 46
46 -
 47
47 -
 48
48 -
 49
49 -
 50
50 -
 51
51 -
 52
52 -
 53
53 -
 54
54 -
 55
55 -
 56
56 -
 57
57 -
 58
58 -
 59
59 -
 60
60 -
 61
61 -
 62
62 -
 63
63 -
 64
64 -
 65
65 -
 66
66 -
67
-
68
 |
 |

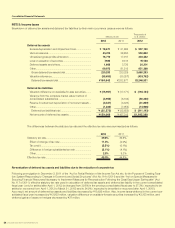
54 SUZUKI MOTOR CORPORATION
Consolidated Financial Statements
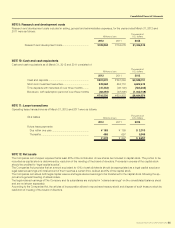
NOTE 8: Income taxes
Breakdown of deferred tax assets and deferred tax liabilities by their main occurrence causes were as follows.
Millions of yen
Thousands of
U.S. dollars
2012 2011 2012
Deferred tax assets
Excess-depreciation and Impairment loss ....................... ¥ 78,671 ¥ 81,896 $ 957,190
Various reserves ................................................................. 45,274 38,850 550,852
Unrealized gross profits elimination .................................. 16,719 17,917 203,422
Loss on valuation of securities .......................................... 7,985 9,413 97,158
Deferred assets and others ............................................... 1,668 3,736 20,301
Other ................................................................................... 69,973 81,513 851,368
Gross deferred tax assets total ....................................... 220,293 233,329 2,680,293
Valuation allowance ........................................................... (35,650) (30,357) (433,762)
Deferred tax assets total ................................................. ¥184,642 ¥202,971 $2,246,531
Deferred tax liabilities
Valuation difference on available-for-sale securities ........ ¥ (15,957) ¥ (17,171) $ (194,154)
Variance from the complete market value method of
consolidated subsidiaries ................................................. (4,952) (6,104) (60,250)
Reserve for advanced depreciation of noncurrent assets
... (3,437) (4,423) (41,829)
Other ................................................................................... (1,225) (7,955) (14,908)
Deferred tax liabilities total .............................................. ¥ (25,572) ¥ (35,655) $ (311,143)
Net amounts of deferred tax assets .................................. ¥159,069 ¥167,315 $1,935,388
The differences between the statutory tax rate and the effective tax rate were summarized as follows.
2012 2011
Statutory tax rate .................................................................... 39.8% 39.8%
Effect of change of tax rate ............................................... 11.4% (0.0%)
Tax credit ............................................................................ (5.5%) (0.1%)
Difference in foreign subsidiaries tax rate ........................ (3.1%) (4.1%)
Other ................................................................................... 2.5% 9.2%
Effective tax rate .................................................................... 45.0% 44.8%
Re-evaluation of deferred tax assets and liabilities due to the reduction of corporate tax
Following promulgation in December 2, 2011 of the “Act for Partial Revision of the Income Tax Act etc. for the Purpose of Creating Taxa-
tion System Responding to Changes in Economic and Social Structures” (Act No.114 of 2011) and the “Act on Special Measures for
Securing Financial Resources Necessary to Implement Measures for Reconstruction Following the Great East Japan Earthquake” (Act
No.117 of 2011), effective statutory tax rate used in calculation of deferred tax assets and deferred tax liability in the current consolidated
fiscal year ( only for settled after April 1, 2012) is changed from 39.8% in the previous consolidated fiscal year to 37.2% ( expected to be
settled or recovered from April 1, 2012 to March 31, 2015) and to 34.9% ( expected to be settled or recovered after April 1, 2015).
As a result, net amount of deferred tax assets and liabilities decreased by ¥10,626 million. Also, income taxes-deferred in the current con-
solidated fiscal year increased by ¥12,802 million, valuation difference on available-for-sale securities increased by ¥2,203 million, and
deferred gains or losses on hedges decreased by ¥27 million.