Suzuki 2012 Annual Report Download - page 61
Download and view the complete annual report
Please find page 61 of the 2012 Suzuki annual report below. You can navigate through the pages in the report by either clicking on the pages listed below, or by using the keyword search tool below to find specific information within the annual report.-
 1
1 -
2
-
3
-
4
-
5
-
6
-
7
-
8
-
9
-
10
-
11
-
12
-
13
-
14
-
15
-
16
-
17
-
18
-
19
-
20
-
21
-
22
-
23
-
24
-
25
-
26
-
27
-
28
-
29
-
30
-
31
-
32
-
33
-
34
-
35
-
36
-
37
-
38
-
39
-
40
-
41
-
42
-
43
-
44
-
45
-
46
-
47
-
48
-
49
-
50
-
 51
51 -
 52
52 -
 53
53 -
 54
54 -
 55
55 -
 56
56 -
 57
57 -
 58
58 -
 59
59 -
 60
60 -
 61
61 -
 62
62 -
 63
63 -
 64
64 -
 65
65 -
 66
66 -
 67
67 -
 68
68
 |
 |
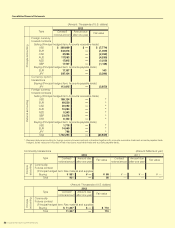
Consolidated Financial Statements
SUZUKI MOTOR CORPORATION 59
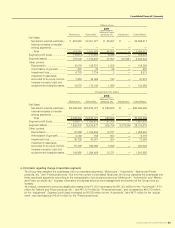
Millions of yen
2011
Motorcycle Automobile
Marine & Power
products, etc. Adjustment Consolidated
Net Sales:
Net sales to external customers
... ¥ 257,682 ¥2,301,977 ¥ 48,557 ¥ — ¥2,608,217
Internal net sales or transfer
among segments ...................... — — — — —
Total 257,682 2,301,977 48,557 — 2,608,217
Segment profit (loss) ..................... (10,814) 111,052 6,696 — 106,934
Segment assets ............................ 187,000 1,316,400 47,002 673,941 2,224,344
Other content:
Depreciation .............................. 10,079 126,781 1,508 — 138,368
Amortization of goodwill ............ 267 76 26 — 370
Impairment loss ......................... 6,776 1,734 2 — 8,513
Investment in associates
accounted for by equity method...
7,382 33,495 732 — 41,610
Increase in property, plant and
equipment and intangible assets ...
13,875 115,345 1,068 — 130,289
Thousands of U.S. dollars
2012
Motorcycle Automobile
Marine & Power
products, etc. Adjustment Consolidated
Net Sales:
Net sales to external customers
... $3,099,660 $26,876,377 $ 589,558 $ — $30,565,596
Internal net sales or transfer
among segments ...................... — — — — —
Total 3,099,660 26,876,377 589,558 — 30,565,596
Segment profit (loss) ..................... (29,611) 1,393,979 87,202 — 1,451,570
Segment assets ............................ 1,892,970 16,235,877 505,724 9,379,046 28,013,619
Other content:
Depreciation .............................. 81,388 1,159,962 13,271 — 1,254,622
Amortization of goodwill ............ 5,156 768 853 — 6,778
Impairment loss ......................... 30,728 42,387 250 — 73,366
Investment in associates
accounted for by equity method...
67,405 348,998 3,942 — 420,346
Increase in property, plant and
equipment and intangible assets ...
143,980 1,384,428 13,271 — 1,541,680
4. Information regarding change of reportable segments
The Group has classified the businesses into four reportable segments,” Motorcycle”, “Automobile”, “Marine and Power
products, etc.” and “Financial services”. But from the current consolidated fiscal year, the Group classifies the businesses into
three reportable segments, according to the characteristic of products and services “Motorcycle”, “Automobile” and “Marine
and Power products, etc.” to grasp information of business structure and management environment of the Group more ac-
curately.
As a result, compared to previous classification sales of the FY 2010 decreased by ¥21,053 million for the “Automobile”, ¥ 91
million for “Marine and Power products, etc.”, and ¥61,127 million for “Financial services”, and increased by ¥82,272 million
for the “adjustment”. Segment profit (loss) increased by ¥2,523 million for the “Automobile”, and ¥477 million for the “adjust-
ment”, and decreased by ¥3,001 million for the “Financial services”.