Suzuki 2012 Annual Report Download - page 6
Download and view the complete annual report
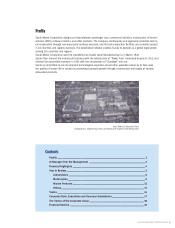
Please find page 6 of the 2012 Suzuki annual report below. You can navigate through the pages in the report by either clicking on the pages listed below, or by using the keyword search tool below to find specific information within the annual report.-
 1
1 -
 2
2 -
 3
3 -
 4
4 -
 5
5 -
 6
6 -
 7
7 -
 8
8 -
 9
9 -
 10
10 -
 11
11 -
 12
12 -
 13
13 -
 14
14 -
 15
15 -
 16
16 -
 17
17 -
18
-
19
-
20
-
21
-
22
-
23
-
24
-
25
-
26
-
27
-
28
-
29
-
30
-
31
-
32
-
33
-
34
-
35
-
36
-
37
-
38
-
39
-
40
-
41
-
42
-
43
-
44
-
45
-
46
-
47
-
48
-
49
-
50
-
51
-
52
-
53
-
54
-
55
-
56
-
57
-
58
-
59
-
60
-
61
-
62
-
63
-
64
-
65
-
66
-
67
-
68
 |
 |

4 SUZUKI MOTOR CORPORATION
Financial Highlights
SUZUKI MOTOR CORPORATION
AND CONSOLIDATED SUBSIDIARIES
Years ended March 31, 2012 and 2011
Millions of yen
(except per share amounts)
Thousands of U.S.
dollars (except per
share amounts)
2012 2011 2012
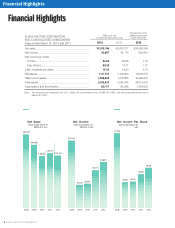
Net sales ................................................................................ ¥2,512,186 ¥2,608,217 $30,565,596
Net income............................................................................. 53,887 45,174 655,641
Net income per share:
Primary ............................................................................... 96.06 80.65 1.16
Fully diluted ........................................................................ 88.28 74.11 1.07
Cash dividends per share ..................................................... 15.00 13.00 0.18
Net assets .............................................................................. 1,111,757 1,106,999 13,526,678
Total current assets ................................................................ 1,509,568 1,372,885 18,366,815
Total assets ............................................................................ 2,302,439 2,224,344 28,013,619
Depreciation and amortization .............................................. 103,117 138,368 1,254,622
Note: Yen amounts are translated into U.S. dollars, for convenience only, at ¥82.19= US$1, the prevailing exchange rate on
March 30, 2012.
2,469,063
2,608,217
3,004,888
3,502,419
80,254
27,429 28,913
45,174
177.96
61.68 62.76
80.65
2,512,186
53,887
96.06
Years ended March 31
(Millions of yen)
Net Sales
2008
Years ended March 31
(Millions of yen)
Net Income
2008
Years ended March 31
(yen)
Net Income Per Share
20082009 2010 2010 2011 2012 20102009 2009 2011 20122011 2012