Suzuki 2012 Annual Report Download - page 44
Download and view the complete annual report
Please find page 44 of the 2012 Suzuki annual report below. You can navigate through the pages in the report by either clicking on the pages listed below, or by using the keyword search tool below to find specific information within the annual report.-
 1
1 -
2
-
3
-
4
-
5
-
6
-
7
-
8
-
9
-
10
-
11
-
12
-
13
-
14
-
15
-
16
-
17
-
18
-
19
-
20
-
21
-
22
-
23
-
24
-
25
-
26
-
27
-
28
-
29
-
30
-
31
-
32
-
33
-
 34
34 -
 35
35 -
 36
36 -
 37
37 -
 38
38 -
 39
39 -
 40
40 -
 41
41 -
 42
42 -
 43
43 -
 44
44 -
 45
45 -
 46
46 -
 47
47 -
 48
48 -
 49
49 -
 50
50 -
 51
51 -
 52
52 -
 53
53 -
 54
54 -
55
-
56
-
57
-
58
-
59
-
60
-
61
-
62
-
63
-
64
-
65
-
66
-
67
-
68
 |
 |

42 SUZUKI MOTOR CORPORATION
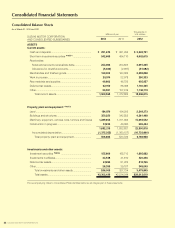
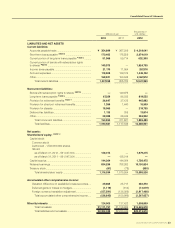
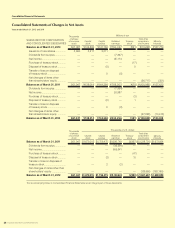
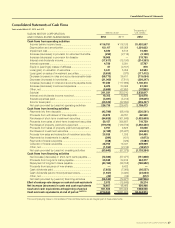
Consolidated Financial Statements
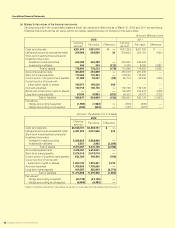
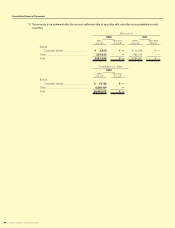
(b) Matters for fair values of the financial instruments
Carrying amounts in the consolidated balance sheet, fair values and difference as of March 31, 2012 and 2011 are as follows.
Financial instruments whose fair value cannot be reliably determined are not included in the below table.
(Amount: Millions of yen)
2012 2011
Carrying
amount Fair value Difference Carrying
amount Fair value Difference
Cash and deposits ¥291,670 ¥291,670 ¥ — ¥261,264 ¥261,264 ¥ —
Notes and accounts receivables-trade 254,066 254,099 32 204,603 204,181 (421)
Short-term investment securities and
Investment securities
Available-for-sale securities
Investments in affiliates
232,499
456
232,499
243
—
(212)
240,843
5,575
240,843
8,262
—
2,687
Total of assets 778,692 778,512 (179) 712,286 714,552 2,265
Accounts payable-trade 354,899 354,899 — 267,209 267,209 —
Short-term loans payable 170,463 170,463 — 178,559 178,559 —
Current portion of long-term loans payable
51,968 52,027 (58) 59,714 59,935 (220)
Current portion of bonds with
subscription rights to shares 149,975 149,525 449 ———
Accrued expenses
140,150 140,150 — 139,129 139,129 —
Bonds with subscription rights to shares
———149,975 150,274 (299)
Long-term loans payable 67,359 67,883 (523) 96,333 97,070 (737)
Total of liabilities 934,817 934,949 (132) 890,921 892,179 (1,257)
Derivatives
Hedge accounting is applied
Hedge accounting is not applied
(1,983
(533
)
)
(1,983
(533
)
)
—
—
(900
(327
)
)
(900
(327
)
)
—
—
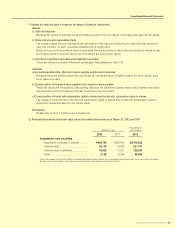
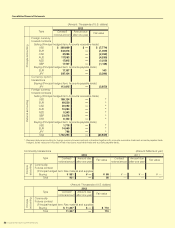
(Amount: Thousands of U.S. dollars)
2012
Carrying
amount Fair value Difference
Cash and deposits $3,548,731 $3,548,731 $ —
Notes and accounts receivables-trade 3,091,205 3,091,606 400
Short-term investment securities and
Investment securities
Available-for-sale securities
Investments in affiliates
2,828,808
5,551
2,828,808
2,962
—
(2,588)
Total of assets 9,474,297 9,472,109 (2,188)
Accounts payable-trade 4,318,041 4,318,041 —
Short-term loans payable 2,074,019 2,074,019 —
Current portion of long-term loans payable
632,300 633,010 (709)
Current portion of bonds with
subscription rights to shares 1,824,735 1,819,261 5,474
Accrued expenses
1,705,205 1,705,205 —
Long-term loans payable 819,555 825,929 (6,373)
Total of liabilities 11,373,858 11,375,468 (1,609)
Derivatives*
Hedge accounting is applied
Hedge accounting is not applied
(24,139
(6,489
)
)
(24,139
(6,489
)
)
—
—
* Assets or liabilities derived from derivatives are shown on a net basis and net liabilities are shown as ( ).