Suzuki 2012 Annual Report Download - page 47
Download and view the complete annual report
Please find page 47 of the 2012 Suzuki annual report below. You can navigate through the pages in the report by either clicking on the pages listed below, or by using the keyword search tool below to find specific information within the annual report.-
 1
1 -
2
-
3
-
4
-
5
-
6
-
7
-
8
-
9
-
10
-
11
-
12
-
13
-
14
-
15
-
16
-
17
-
18
-
19
-
20
-
21
-
22
-
23
-
24
-
25
-
26
-
27
-
28
-
29
-
30
-
31
-
32
-
33
-
34
-
35
-
36
-
 37
37 -
 38
38 -
 39
39 -
 40
40 -
 41
41 -
 42
42 -
 43
43 -
 44
44 -
 45
45 -
 46
46 -
 47
47 -
 48
48 -
 49
49 -
 50
50 -
 51
51 -
 52
52 -
 53
53 -
 54
54 -
 55
55 -
 56
56 -
 57
57 -
58
-
59
-
60
-
61
-
62
-
63
-
64
-
65
-
66
-
67
-
68
 |
 |

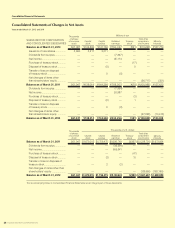
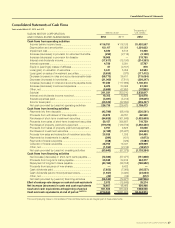
Consolidated Financial Statements
SUZUKI MOTOR CORPORATION 45
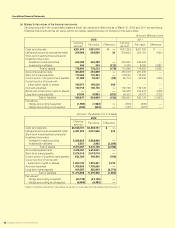
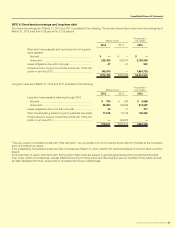
(c) Securities
a. Available-for-sale securities quoted at the stock exchange as of March 31, 2012 and 2011
Millions of yen
2012
Acquisition
cost
Carrying
amount Difference
Securities for which the carrying amount exceeds the
acquisition costs
Stocks ................................................................................. ¥ 72,961 ¥121,006 ¥ 48,044
Bonds ................................................................................. 2,809 2,809 —
Other ................................................................................... 90,892 92,038 1,145
Sub Total ¥166,663 ¥215,853 ¥ 49,190
Securities for which the carrying amount does not exceed
the acquisition cost
Stocks ................................................................................. ¥ 19,723 ¥ 16,645 ¥ (3,077)
Bonds ................................................................................. — — —
Other ................................................................................... — — —
Sub Total ¥ 19,723 ¥ 16,645 ¥ (3,077)
Total ¥186,387 ¥232,499 ¥ 46,112
Millions of yen
2011
Acquisition
cost
Carrying
amount Difference
Securities for which the carrying amount exceeds the
acquisition costs
Stocks ................................................................................. ¥ 68,712 ¥115,207 ¥ 46,495
Bonds ................................................................................. — — —
Other ................................................................................... 75,801 77,487 1,686
Sub Total ¥144,513 ¥192,695 ¥ 48,181
Securities for which the carrying amount does not exceed
the acquisition cost
Stocks ................................................................................. ¥ 26,736 ¥ 22,232 ¥ (4,503)
Bonds ................................................................................. 26,201 25,915 (286)
Other ................................................................................... — — —
Sub Total ¥ 52,938 ¥ 48,148 ¥ (4,789)
Total ¥197,452 ¥240,843 ¥ 43,391
Thousands of U.S. dollars
2012
Acquisition
cost
Carrying
amount Difference
Securities for which the carrying amount exceeds the
acquisition costs
Stocks ................................................................................. $ 887,718 $1,472,275 $548,556
Bonds ................................................................................. 34,180 34,180 —
Other ................................................................................... 1,105,884 1,119,822 13,938
Sub Total $2,027,783 $2,626,278 $598,495
Securities for which the carrying amount does not exceed
the acquisition cost
Stocks ................................................................................. $ 239,977 $ 202,529 $ (37,448)
Bonds ................................................................................. — — —
Other ................................................................................... — — —
Sub Total $ 239,977 $ 202,529 $ (37,448)
Total $2,267,761 $2,828,808 $561,047