Suzuki 2012 Annual Report Download - page 62
Download and view the complete annual report
Please find page 62 of the 2012 Suzuki annual report below. You can navigate through the pages in the report by either clicking on the pages listed below, or by using the keyword search tool below to find specific information within the annual report.-
 1
1 -
2
-
3
-
4
-
5
-
6
-
7
-
8
-
9
-
10
-
11
-
12
-
13
-
14
-
15
-
16
-
17
-
18
-
19
-
20
-
21
-
22
-
23
-
24
-
25
-
26
-
27
-
28
-
29
-
30
-
31
-
32
-
33
-
34
-
35
-
36
-
37
-
38
-
39
-
40
-
41
-
42
-
43
-
44
-
45
-
46
-
47
-
48
-
49
-
50
-
51
-
 52
52 -
 53
53 -
 54
54 -
 55
55 -
 56
56 -
 57
57 -
 58
58 -
 59
59 -
 60
60 -
 61
61 -
 62
62 -
 63
63 -
 64
64 -
 65
65 -
 66
66 -
 67
67 -
 68
68
 |
 |

60 SUZUKI MOTOR CORPORATION
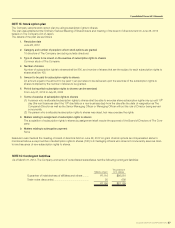
Consolidated Financial Statements
(Reference information)
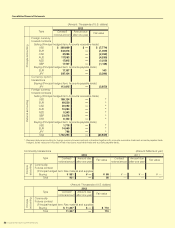
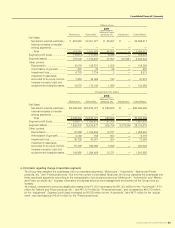
As reference information, operating results by geographical areas were as follows
(a) The amount of net sales, operating income or loss based on location of
The Company and its consolidated subsidiaries (Years ended March 31)
Millions of yen
2012
Japan Europe
North
America Asia
Other
areas* Eliminations
Consoli-
dated
Net Sales:
Net sales to external customers ...
¥1,185,782
¥ 304,650 ¥ 99,240 ¥ 844,878 ¥ 77,634 ¥ —
¥2,512,186
Internal net sales or transfer
among geographical areas ..........
360,362
2,035 2,482 24,320 1 (389,202)
—
Total
1,546,145
306,686 101,722 869,198 77,635 (389,202)
2,512,186
Operating income .............................
79,575 2,213 362 31,596 2,223 3,333 119,304
Millions of yen
2011
Japan Europe
North
America Asia
Other
areas* Eliminations
Consoli-
dated
Net Sales:
Net sales to external customers ...
¥1,181,928
¥ 327,451 ¥ 94,907 ¥ 928,772 ¥ 75,158 ¥ —
¥2,608,217
Internal net sales or transfer
among geographical areas ..........
390,487
5,508 2,516 19,816 0 (418,329)
—
Total
1,572,416
332,960 97,423 948,588 75,159 (418,329)
2,608,217
Operating income (loss) ...................
53,163 408 (2,180
)
46,904 3,663 4,975 106,934
Thousands of U.S. dollars
2012
Japan Europe
North
America Asia
Other
areas* Eliminations
Consoli-
dated
Net sales:
Net sales to external customers ...
$14,427,337
$3,706,665 $1,207,451
$10,279,571
$944,570
$
—
$30,565,596
Internal net sales or transfer
among geographical areas ..........
4,384,508
24,770 30,201
295,900
15
(4,735,395
)
—
Total
18,811,845
3,731,436 1,237,652
10,575,472
944,585
(4,735,395
)
30,565,596
Operating income .............................
968,193
26,930 4,406
384,434
27,047
40,557
1,451,570
* “Other areas” consists principally of Oceania and South America.