Square Enix 2005 Annual Report Download - page 60
Download and view the complete annual report
Please find page 60 of the 2005 Square Enix annual report below. You can navigate through the pages in the report by either clicking on the pages listed below, or by using the keyword search tool below to find specific information within the annual report.-
 1
1 -
2
-
3
-
4
-
5
-
6
-
7
-
8
-
9
-
10
-
11
-
12
-
13
-
14
-
15
-
16
-
17
-
18
-
19
-
20
-
21
-
22
-
23
-
24
-
25
-
26
-
27
-
28
-
29
-
30
-
31
-
32
-
33
-
34
-
35
-
36
-
37
-
38
-
39
-
40
-
41
-
42
-
43
-
44
-
45
-
46
-
47
-
48
-
49
-
 50
50 -
 51
51 -
 52
52 -
 53
53 -
 54
54 -
 55
55 -
 56
56 -
 57
57 -
 58
58 -
 59
59 -
 60
60 -
 61
61 -
 62
62 -
 63
63 -
 64
64
 |
 |

58 SQUARE ENIX CO., LTD.
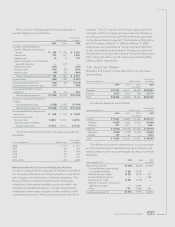
17. Segment Information
Operating segment information
The Company has five operating segments; (i) games, (ii)
online games, (iii) Mobilephone Content, (iv) Publication,
and (v) Others. Revenue from disc sales for Final Fantasy XI
is included in the online games segment. They are defined
for which separate financial information is available and reg-
ularly reviewed by the Company’s chief operating decision
maker. The Company’s chief operating decision maker
utilizes the information on operating income (loss) from
each operating segment and allocates resources to each
respective segment. Accordingly, these segments consti-
tute “Reportable Segments” for purposes of SFAS No. 131
“
Disclosures about Segments of an Enterprise and Related
Information.
” Since the Company is listed on Tokyo Stock
Exchange, the segment information utilized by the Com-
pany’s chief decision maker is based on JPNGAAP. The
differences between JPNGAAP and U.S.GAAP are
indicated in the tables below.
Thousands of
Years ended March 31 Millions of yen U.S. dollars
Net sales 2005 2004 2003 2005
(Unaudited)
Games ¥41,945 ¥37,988 ¥11,912 $390,584
Online games 13,853 8,924 942 129,000
Mobilephone Content 4,557 2,793 1,656 42,437
Publication 10,860 9,671 5,920 101,125
Others 2,650 3,826 1,447 24,674
Corporate and elimination ——— —
Total 73,865 63,202 21,877 687,820
U.S.GAAP adjustments 198 (107) 6 1,840
Consolidated ¥74,063 ¥63,095 ¥21,883 $689,660
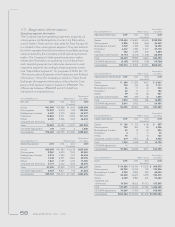
Thousands of
Years ended March 31 Millions of yen U.S. dollars
Operating expenses 2005 2004 2003 2005
(Unaudited)
Games ¥22,295 ¥21,583 ¥08,278 $207,608
Online games 8,867 6,575 1,309 82,565
Mobilephone Content 2,818 1,633 872 26,244
Publication 7,448 6,491 4,582 69,355
Others 1,867 2,799 1,200 17,385
Corporate and elimination 4,131 4,722 1,033 38,470
Total 47,426 43,803 17,274 441,627
U.S.GAAP adjustments 2,323 9,811 213 21,628
Consolidated ¥49,749 ¥53,613 ¥17,487 $463,255
Thousands of
Years ended March 31 Millions of yen U.S. dollars
Operating income (loss) 2005 2004 2003 2005
(Unaudited)
Games ¥19,650 ¥16,404 ¥3,634 $182,976
Online games 4,986 2,348 (366) 46,435
Mobilephone Content 1,739 1,159 784 16,193
Publication 3,412 3,180 1,337 31,770
Others 783 1,029 247 7,289
Corporate and elimination (4,131) (4,722) (1,033) (38,470)
Total 26,439 19,398 4,603 246,193
U.S.GAAP adjustments (2,125) (9,916) (208) (19,788)
Consolidated ¥24,314 ¥09,482 ¥4,396 $226,405
Thousands of
Years ended March 31 Millions of yen U.S. dollars
Depreciation and amortization 2005 2004 2003 2005
(Unaudited)
Games ¥0,694 ¥0,870 ¥207 $06,461
Online games 770 742 69 7,171
Mobilephone Content 36 17 20 334
Publication 20 12 8 182
Others 99 94 46 927
Corporate and elimination 195 239 36 1,820
Total 1,814 1,974 386 16,895
U.S.GAAP adjustments 2,641 3,432 — 24,585
Consolidated ¥4,455 ¥5,406 ¥386 $41,480
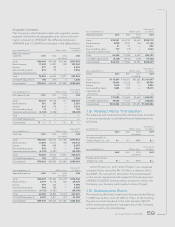
Thousands of
Years ended March 31 Millions of yen U.S. dollars
Capital expenditures 2005 2004 2003 2005
(Unaudited)
Games ¥0,106 ¥0,175 ¥094 $00,987
Online games 725 384 59 6,756
Mobilephone Content 52 12 25 484
Publication 403 35
Others 18 —74 166
Corporate and elimination 619 1,976 46 5,762
Total 1,524 2,548 301 14,190
U.S.GAAP adjustments ——— —
Consolidated ¥1,524 ¥2,548 ¥301 $14,190
Thousands of
Years ended March 31 Millions of yen U.S. dollars
Assets 2005 2004 2003 2005
(Unaudited)
Games ¥064,860 ¥055,104 ¥05,302 $0,603,970
Online games 20,753 14,215 700 193,246
Mobilephone Content 4,725 2,583 580 44,004
Publication 20,448 14,225 3,094 190,410
Others 6,169 5,983 676 57,443
Corporate and
elimination 14,740 18,523 47,113 137,255
Total 131,695 110,633 57,465 1,226,328
U.S.GAAP adjustments 70,669 71,415 15 658,058
Consolidated ¥202,364 ¥182,048 ¥57,480 $1,884,386