Square Enix 2005 Annual Report Download - page 41
Download and view the complete annual report
Please find page 41 of the 2005 Square Enix annual report below. You can navigate through the pages in the report by either clicking on the pages listed below, or by using the keyword search tool below to find specific information within the annual report.-
 1
1 -
2
-
3
-
4
-
5
-
6
-
7
-
8
-
9
-
10
-
11
-
12
-
13
-
14
-
15
-
16
-
17
-
18
-
19
-
20
-
21
-
22
-
23
-
24
-
25
-
26
-
27
-
28
-
29
-
30
-
 31
31 -
 32
32 -
 33
33 -
 34
34 -
 35
35 -
 36
36 -
 37
37 -
 38
38 -
 39
39 -
 40
40 -
 41
41 -
 42
42 -
 43
43 -
 44
44 -
 45
45 -
 46
46 -
 47
47 -
 48
48 -
 49
49 -
 50
50 -
 51
51 -
52
-
53
-
54
-
55
-
56
-
57
-
58
-
59
-
60
-
61
-
62
-
63
-
64
 |
 |

39
Annual Report 2005
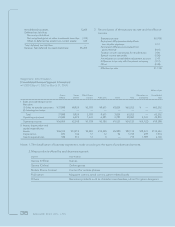
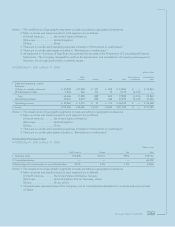
Notes: 1. The classification of geographic segments is made according to geographical distances.
2. Main countries and areas included in each segment are as follows:
(1) North America.............. the United States of America
(2) Europe........................... United Kingdom
(3) Asia................................ China
3. There are no unallocated operating expenses included in “Eliminations or unallocated.”
4. There are no unallocated assets included in “Eliminations or unallocated.”
5. As explained in “Summary of Significant Accounting Policies used in the Preparation of Consolidated Financial
Statements, ”the Company changed the method for depreciation and amortization of property and equipment.
However, this change did not have a material impact.
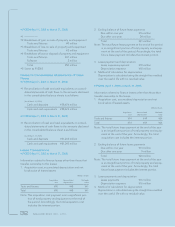
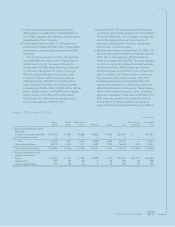
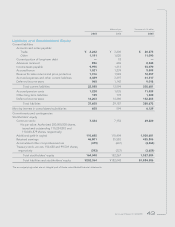
• FY2004 (April 1, 2004 to March 31, 2005)
Millions of yen
North Eliminations or Consolidated
Japan America Europe Asia Total unallocated total
I Sales and operating income
Net sales
(1) Sales to outside customers ¥060,949 ¥11,528 ¥0,577 ¥0,810 ¥073,864 ¥ — ¥073,864
(2) Intersegment sales 3,436 360 312 13 4,123 (4,123) —
Total 64,386 11,889 889 823 77,988 (4,123) 73,864
Operating expenses 40,425 9,619 858 646 51,550 (4,123) 47,426
Operating income ¥023,960 ¥02,270 ¥0,031 ¥0,176 ¥026,438 ¥ — ¥026,438
II Assets ¥118,306 ¥10,694 ¥1,010 ¥1,683 ¥131,695 ¥ — ¥131,695
Notes: 1. The classification of geographic segments is made according to geographical distances.
2. Main countries and areas included in each segment are as follows:
(1) North America.............. the United States of America
(2) Europe........................... United Kingdom
(3) Asia................................ China
3. There are no unallocated operating expenses included in “Eliminations or unallocated.”
4. There are no unallocated assets included in “Eliminations or unallocated.”
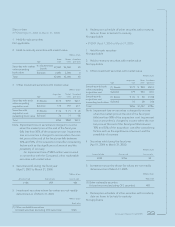
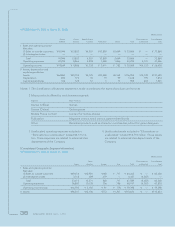
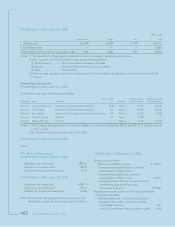
[Consolidated Overseas Sales]
• FY2003 (April 1, 2003 to March 31, 2004)
Millions of yen
North America Europe Asia Total
I Overseas sales ¥15,618 ¥2,121 ¥972 ¥18,712
II Consolidated sales — — — 63,202
III Percentage of overseas sales to consolidated sales 24.7% 3.4% 1.5% 29.6%
Notes: 1. The classification of geographic segments is made according to geographical distances.
2. Main countries and areas included in each segment are as follows:
(1) North America.............. the United States of America, Canada
(2) Europe........................... United Kingdom, France, Germany, others
(3) Asia................................ China, others
3. Overseas sales represent sales of the Company and its consolidated subsidiaries to countries and areas outside
of Japan.