Square Enix 2005 Annual Report Download - page 38
Download and view the complete annual report
Please find page 38 of the 2005 Square Enix annual report below. You can navigate through the pages in the report by either clicking on the pages listed below, or by using the keyword search tool below to find specific information within the annual report.-
 1
1 -
2
-
3
-
4
-
5
-
6
-
7
-
8
-
9
-
10
-
11
-
12
-
13
-
14
-
15
-
16
-
17
-
18
-
19
-
20
-
21
-
22
-
23
-
24
-
25
-
26
-
27
-
 28
28 -
 29
29 -
 30
30 -
 31
31 -
 32
32 -
 33
33 -
 34
34 -
 35
35 -
 36
36 -
 37
37 -
 38
38 -
 39
39 -
 40
40 -
 41
41 -
 42
42 -
 43
43 -
 44
44 -
 45
45 -
 46
46 -
 47
47 -
 48
48 -
49
-
50
-
51
-
52
-
53
-
54
-
55
-
56
-
57
-
58
-
59
-
60
-
61
-
62
-
63
-
64
 |
 |

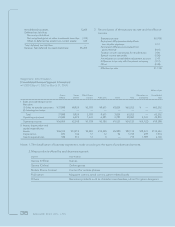
36 SQUARE ENIX CO., LTD.
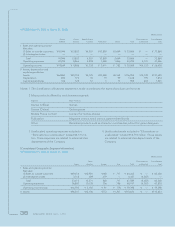
Segment Information
[Consolidated Business Segment Information]
• FY2003 (April 1, 2003 to March 31, 2004)
Millions of yen
Games Games Mobile Phone Eliminations or Consolidated
(Offline) (Online) Content Publication Others Total unallocated total
I Sales and operating income
Net sales
(1) Sales to outside customers ¥37,988 ¥8,924 ¥2,793 ¥9,671 ¥3,824 ¥63,202 ¥ — ¥63,202
(2) Intersegment sales ————————
Total 37,988 8,924 2,793 9,671 3,824 63,202 — 63,202
Operating expenses 21,583 6,575 1,633 6,491 2,797 39,081 4,722 43,803
Operating income ¥16,404 ¥2,348 ¥1,159 ¥3,180 ¥1,027 ¥24,120 ¥ (4,722) ¥19,398
II Assets, depreciation and
capital expenditures
Assets ¥55,104 ¥14,215 ¥2,583 ¥14,225 ¥5,980 ¥92,110 ¥18,523 ¥110,633
Depreciation 870 742 17 12 92 1,735 239 1,974
Capital expenditures 188 513 12 0 — 715 1,989 2,704
Notes: 1. The classification of business segments is made according to the types of products and services.
2. Major products offered by each business segment
Segment Major Products
Games (Offline) Games
Games (Online) Online games
Mobile Phone Content Content for mobile phones
Publication Magazine comics, serial comics, game-related books
Others Derivative products such as character merchandise, school for game designers
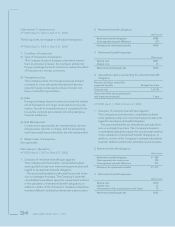
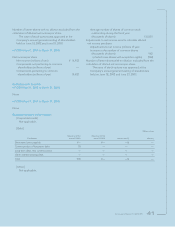
Net deferred tax assets 5,209
Deferred tax liabilities
Non-current liabilities
Net unrealized gains on other investment securities (324)
Offset to deferred tax assets (non-current assets) 324
Total deferred tax liabilities −
Balance: Net deferred tax assets (liabilities) ¥5,209
2. Reconciliation of the statutory tax rate and the effective
tax rate
Statutory tax rate 40.70%
Permanent differences excluded from
non-taxable expenses 0.17
Permanent differences excluded from
gross revenue (0.01)
Taxation on per capita basis for residents tax 0.04
Special income tax credits (0.56)
Amortization on consolidation adjustment account 2.43
Difference in tax rate with the parent company (1.17)
Other (0.49)
Effective tax rate 41.11%