Square Enix 2005 Annual Report Download - page 40
Download and view the complete annual report
Please find page 40 of the 2005 Square Enix annual report below. You can navigate through the pages in the report by either clicking on the pages listed below, or by using the keyword search tool below to find specific information within the annual report.-
 1
1 -
2
-
3
-
4
-
5
-
6
-
7
-
8
-
9
-
10
-
11
-
12
-
13
-
14
-
15
-
16
-
17
-
18
-
19
-
20
-
21
-
22
-
23
-
24
-
25
-
26
-
27
-
28
-
29
-
 30
30 -
 31
31 -
 32
32 -
 33
33 -
 34
34 -
 35
35 -
 36
36 -
 37
37 -
 38
38 -
 39
39 -
 40
40 -
 41
41 -
 42
42 -
 43
43 -
 44
44 -
 45
45 -
 46
46 -
 47
47 -
 48
48 -
 49
49 -
 50
50 -
51
-
52
-
53
-
54
-
55
-
56
-
57
-
58
-
59
-
60
-
61
-
62
-
63
-
64
 |
 |

38 SQUARE ENIX CO., LTD.
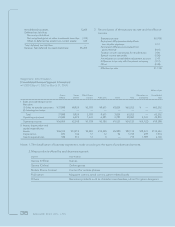
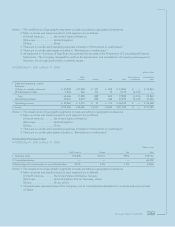
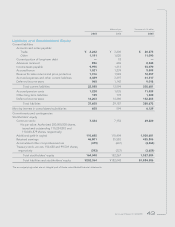
[Consolidated Geographic Segment Information]
• FY2003 (April 1, 2003 to March 31, 2004)
Millions of yen
North Eliminations or Consolidated
Japan America Europe Asia Total unallocated total
I Sales and operating income
Net sales
(1) Sales to outside customers ¥49,354 ¥12,981 ¥148 ¥0,717 ¥063,202 ¥ — ¥063,202
(2) Intersegment sales 3,718 389 279 — 4,387 (4,387) —
Total 53,073 13,371 428 717 67,589 (4,387) 63,202
Operating expenses 36,880 10,178 336 796 48,191 (4,387) 43,803
Operating income (loss) ¥16,192 ¥03,192 ¥091 ¥ (79) ¥019,398 ¥ — ¥019,398
II Assets ¥96,547 ¥12,106 ¥772 ¥1,207 ¥110,633 ¥ — ¥110,633
3. Unallocated operating expenses included in
“Eliminations or unallocated” totaled ¥4,131 mil-
lion. These expenses are related to administrative
departments of the Company.
4. Unallocated assets included in “Eliminations or
unallocated” totaled ¥14,739 million. These assets
are related to administrative departments of the
Company.
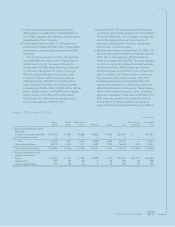
• FY2004 (April 1, 2004 to March 31, 2005)
Millions of yen
Games Games Mobile Phone Eliminations or Consolidated
(Offline) (Online) Content Publication Others Total unallocated total
I Sales and operating income
Net sales
(1) Sales to outside customers ¥41,944 ¥13,853 ¥4,557 ¥10,859 ¥2,649 ¥073,864 ¥ — ¥073,864
(2) Intersegment sales ————————
Total 41,944 13,853 4,557 10,859 2,649 73,864 — 73,864
Operating expenses 22,295 8,866 2,818 7,448 1,866 43,295 4,131 47,426
Operating income ¥19,649 ¥04,986 ¥1,738 ¥03,411 ¥0,782 ¥030,569 ¥ (4,131) ¥026,438
II Assets, depreciation and
capital expenditures
Assets ¥64,860 ¥20,752 ¥4,725 ¥20,448 ¥6,168 ¥116,955 ¥14,739 ¥131,695
Depreciation 693 770 35 19 99 1,618 195 1,814
Capital expenditures 106 725 51 3 17 905 618 1,523
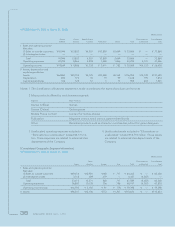
Notes: 1. The classification of business segments is made according to the types of products and services.
2. Major products offered by each business segment
Segment Major Products
Games (Offline) Games
Games (Online) Online games
Mobile Phone Content Content for mobile phones
Publication Magazine comics, serial comics, game-related books
Other Derivative products such as character merchandise, school for game designers