Square Enix 2005 Annual Report Download - page 48
Download and view the complete annual report
Please find page 48 of the 2005 Square Enix annual report below. You can navigate through the pages in the report by either clicking on the pages listed below, or by using the keyword search tool below to find specific information within the annual report.-
 1
1 -
2
-
3
-
4
-
5
-
6
-
7
-
8
-
9
-
10
-
11
-
12
-
13
-
14
-
15
-
16
-
17
-
18
-
19
-
20
-
21
-
22
-
23
-
24
-
25
-
26
-
27
-
28
-
29
-
30
-
31
-
32
-
33
-
34
-
35
-
36
-
37
-
 38
38 -
 39
39 -
 40
40 -
 41
41 -
 42
42 -
 43
43 -
 44
44 -
 45
45 -
 46
46 -
 47
47 -
 48
48 -
 49
49 -
 50
50 -
 51
51 -
 52
52 -
 53
53 -
 54
54 -
 55
55 -
 56
56 -
 57
57 -
 58
58 -
59
-
60
-
61
-
62
-
63
-
64
 |
 |

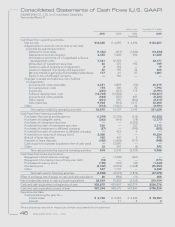
Consolidated Statements of Cash Flows (U.S. GAAP)
SQUARE ENIX CO., LTD. and Consolidated Subsidiaries
Years ended March 31
46 SQUARE ENIX CO., LTD.
Millions of yen Thousands of U.S. dollars
2005 2004 2003 2005
(Unaudited)
Cash flows from operating activities:
Net income ¥14,520 ¥04,355 ¥02,296 $135,207
Adjustments to reconcile net income to net cash
provided by operating activities:
Deferred income taxes (1,486) (673) (1,230) (13,834)
Depreciation and amortization 4,455 5,406 386 41,480
Amortization and write-off of capitalized software
developments costs 7,321 12,723 — 68,171
Write-down of investment securities 80 375 100 749
Losses on sale of property and equipment 2124 — 19
Losses on disposal of property and equipment 50 749 46 466
Minority interest in earnings of consolidated subsidiaries 117 61 27 1,087
Equity in loss of affiliated company —760 — —
Changes in assets and liabilities, net of effects
of acquisitions:
Accounts and notes receivable 4,351 4,849 (50) 40,519
Accrued pension costs 193 200 20 1,794
Inventories (235) (437) 115 (2,191)
Software development costs (12,704) (12,226) — (118,301)
Accounts and notes payable (948) (507) 681 (8,823)
Other assets (281) 555 (460) (2,613)
Other liabilities 9,954 (916) 1,217 92,690
Other (514) (1,261) 44 (4,791)
Net cash provided by operating activities 24,875 14,137 3,192 231,629
Cash flows from investing activities:
Purchases of property and equipment (1,319) (2,709) (215) (12,282)
Purchases of intangible assets (363) (416) (79) (3,377)
Purchases of investment securities —— (2,002) —
Proceeds from sale of investment securities 248 — 120 2,313
Purchases of investment in affiliated company (27) — (795) (255)
Proceeds from sale of investment in affiliated company —423 4 —
Proceeds from maturity of treasury bond 2,000 —— 18,624
Refund of lease deposits 105 407 3 975
Payment of lease deposits (102) (1,843) (771) (948)
Cash acquired in business acquisitions (net of cash used) —12,095 — —
Other 32 292 (2) 295
Net cash provided by (used in) investing activities 574 8,249 (3,737) 5,345
Cash flows from financing activities:
Repayment of short-term borrowings —(1,000) (361) —
Repayment of current portion of long term debt (18) —— (171)
Purchases of treasury stock (155) (147) (47) (1,442)
Dividends paid (3,302) (2,574) (1,468) (30,753)
Other 567 1,147 — 5,288
Net cash used in financing activities (2,908) (2,574) (1,876) (27,078)
Effect of exchange rate changes on cash and cash equivalents 28 (984) (11) 258
Net increase (decrease) in cash and cash equivalents 22,569 18,828 (2,432) 210,154
Cash and cash equivalents at beginning of year ¥58,675 ¥39,847 ¥42,279 $546,376
Cash and cash equivalents at end of year ¥81,244 ¥58,675 ¥39,847 $756,530
Supplemental data:
Cash paid during the year for—
Income taxes ¥02,768 ¥04,794 ¥02,446 $025,783
Interest —11 2 3
The accompanying notes are an integral part of these consolidated financial statements.