Square Enix 2005 Annual Report Download - page 42
Download and view the complete annual report
Please find page 42 of the 2005 Square Enix annual report below. You can navigate through the pages in the report by either clicking on the pages listed below, or by using the keyword search tool below to find specific information within the annual report.-
 1
1 -
2
-
3
-
4
-
5
-
6
-
7
-
8
-
9
-
10
-
11
-
12
-
13
-
14
-
15
-
16
-
17
-
18
-
19
-
20
-
21
-
22
-
23
-
24
-
25
-
26
-
27
-
28
-
29
-
30
-
31
-
 32
32 -
 33
33 -
 34
34 -
 35
35 -
 36
36 -
 37
37 -
 38
38 -
 39
39 -
 40
40 -
 41
41 -
 42
42 -
 43
43 -
 44
44 -
 45
45 -
 46
46 -
 47
47 -
 48
48 -
 49
49 -
 50
50 -
 51
51 -
 52
52 -
53
-
54
-
55
-
56
-
57
-
58
-
59
-
60
-
61
-
62
-
63
-
64
 |
 |

40 SQUARE ENIX CO., LTD.
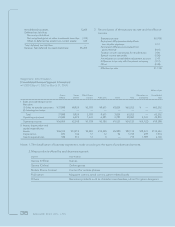
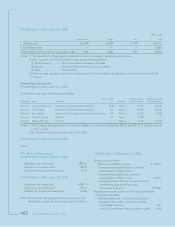
Per Share Information
• FY2003 (April 1, 2003 to March 31, 2004)
Net assets per share (yen) ¥878.85
Net income per share (yen) 100.04
Diluted net income per share (yen) 99.76
• FY2004 (April 1, 2004 to March 31, 2005)
Net assets per share (yen) ¥988.19
Net income per share (yen) 135.63
Diluted net income per share (yen) 134.46
Note: The basis for calculating net income per share and
diluted net income per share is provided as follows.
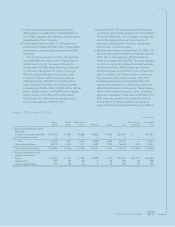
• FY2003 (April 1, 2003 to March 31, 2004)
Net income per share
Net income (millions of yen) ¥010,993
Components not pertaining to common
shareholders (millions of yen) —
Components pertaining to common
shareholders (millions of yen) 10,993
Average number of shares of common stock
outstanding during the fiscal year
(thousands of shares) 109,884
Adjustments to net income used to calculate diluted
net income per share
Adjustments to net income (millions of yen) —
Increase in the number of common shares
(thousands of shares) 316
(of which new shares with acquisition rights) (316)
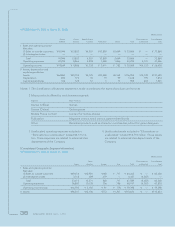
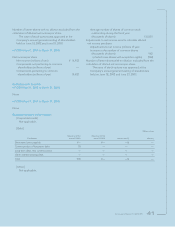
• FY2004 (April 1, 2004 to March 31, 2005)
Millions of yen
North America Europe Asia Total
I Overseas sales ¥12,295 ¥1,298 ¥1,179 ¥14,772
II Consolidated sales — — — 73,864
III Percentage of overseas sales to consolidated sales 16.6% 1.8% 1.6% 20.0%
Notes: 1. The classification of geographic segments is made according to geographical distances.
2. Main countries and areas included in each segment are as follows:
(1) North America.............. the United States of America, Canada
(2) Europe........................... United Kingdom, France, Germany, others
(3) Asia................................ China, others
3. Overseas sales represent sales of the Company and its consolidated subsidiaries to countries and areas outside
of Japan.
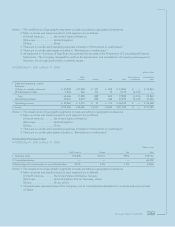
[Related Party Transactions]
• FY2003 (April 1, 2003 to March 31, 2004)
(1) Directors and major individual shareholders
Shares owned Transaction amount Balance at year-end
Relationship Name Occupation (%) Transaction (number of shares) (number of shares)
Director Yasuhiro Fukushima Chairman and representative director 22.3% Note 1 20,000 20,000
Director Yoichi Wada President and representative director 0.0 Note 1 195,500 195,500
Director Keiji Honda
Executive Vice President and representative director
0.0 Note 1 20,000 13,500
Director Yukinobu Chida Director 0.4 Note 1 14,000 ―
Director Makoto Naruke Director —Note 1 51,000 51,000
Notes: 1. The Company has granted stock acquisition rights in accordance with Articles 280-20 and 280-21 of the Commercial
Code of Japan.
2. Mr. Yasuhiro Fukushima retired on June 19, 2004.
• FY2004 (April 1, 2004 to March 31, 2005)
None.