Square Enix 2005 Annual Report Download - page 3
Download and view the complete annual report
Please find page 3 of the 2005 Square Enix annual report below. You can navigate through the pages in the report by either clicking on the pages listed below, or by using the keyword search tool below to find specific information within the annual report.-
 1
1 -
 2
2 -
 3
3 -
 4
4 -
 5
5 -
 6
6 -
 7
7 -
 8
8 -
 9
9 -
 10
10 -
 11
11 -
 12
12 -
 13
13 -
 14
14 -
15
-
16
-
17
-
18
-
19
-
20
-
21
-
22
-
23
-
24
-
25
-
26
-
27
-
28
-
29
-
30
-
31
-
32
-
33
-
34
-
35
-
36
-
37
-
38
-
39
-
40
-
41
-
42
-
43
-
44
-
45
-
46
-
47
-
48
-
49
-
50
-
51
-
52
-
53
-
54
-
55
-
56
-
57
-
58
-
59
-
60
-
61
-
62
-
63
-
64
 |
 |
1
SQUARE ENIX CO., LTD. Annual Report 2005
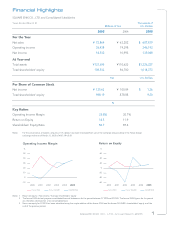
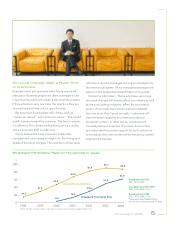
Financial Highlights
For the Year
Net sales ¥ 73,864 ¥ 63,202 $ 687,819
Operating income 26,438 19,398 246,193
Net income 14,932 10,993 139,048
At Year-end
Total assets ¥131,695 ¥110,633 $1,226,327
Total shareholders’ equity 108,933 96,700 1,014,373
Yen U.S. Dollars
Per Share of Common Stock
Net income ¥ 135.63 ¥ 100.04 $ 1.26
Total shareholders’ equity 988.19 878.85 9.20
%
Key Ratios
Operating Income Margin 35.8% 30.7%
Return on Equity 14.5 11.9
Shareholders’ Equity Ratio 82.7 87.4
Notes: For the convenience of readers, amounts in U.S. dollars have been translated from yen at the exchange rate prevailing in the Tokyo foreign
exchange market as of March 31, 2005 of ¥107.39=US $1.
Years Ended March 31 Thousands of
Millions of Yen U.S. Dollars
2005 2004 2005
SQUARE ENIX CO., LTD. and Consolidated Subsidiaries
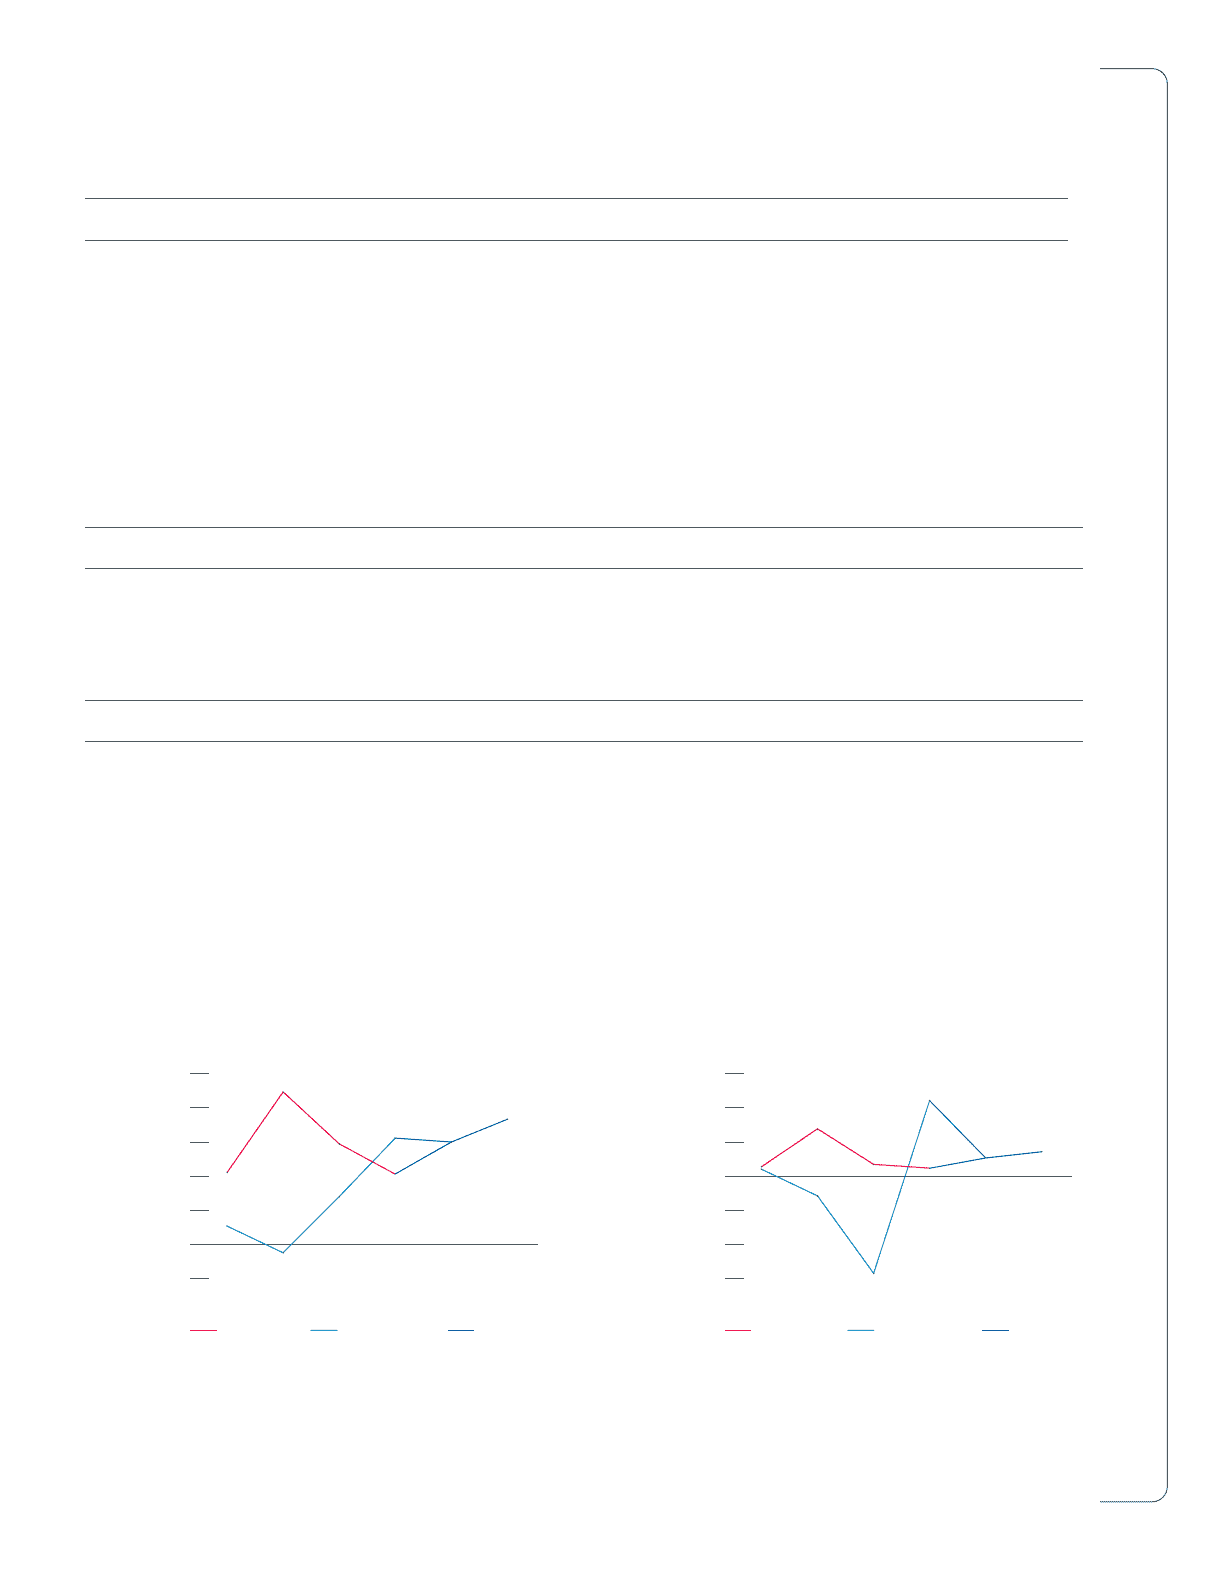
Notes: 1. Return on equity = Net income / Average shareholders’ equity
2. The former ENIX did not prepare consolidated financial statements for the period between FY1999 and FY2000. The former ENIX figures for this period
are, therefore, disclosed on a non-consolidated basis.
3. Return on equity for FY2003 has been calculated using the simple addition of the former ENIX and the former SQUARE’s shareholders’ equity as of the
end of the previous period.
Return on Equity
-60
-40
-20
0
20
40
60
%
2000 2001 2002 2003 2004 2005
Former SQUAREFormer ENIX SQUARE ENIX
Operating Income Margin
-10
0
10
20
30
40
50
%
2000 2001 2002 2003 2004 2005
Former SQUAREFormer ENIX SQUARE ENIX