Square Enix 2005 Annual Report Download - page 18
Download and view the complete annual report
Please find page 18 of the 2005 Square Enix annual report below. You can navigate through the pages in the report by either clicking on the pages listed below, or by using the keyword search tool below to find specific information within the annual report.-
 1
1 -
2
-
3
-
4
-
5
-
6
-
7
-
 8
8 -
 9
9 -
 10
10 -
 11
11 -
 12
12 -
 13
13 -
 14
14 -
 15
15 -
 16
16 -
 17
17 -
 18
18 -
 19
19 -
 20
20 -
 21
21 -
 22
22 -
 23
23 -
 24
24 -
 25
25 -
 26
26 -
 27
27 -
 28
28 -
29
-
30
-
31
-
32
-
33
-
34
-
35
-
36
-
37
-
38
-
39
-
40
-
41
-
42
-
43
-
44
-
45
-
46
-
47
-
48
-
49
-
50
-
51
-
52
-
53
-
54
-
55
-
56
-
57
-
58
-
59
-
60
-
61
-
62
-
63
-
64
 |
 |
16 SQUARE ENIX CO., LTD.
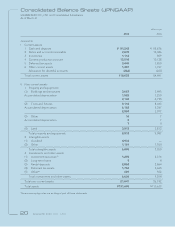
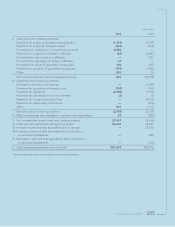
Total Liabilities
Years ended March 31 Millions of yen
2004 2005 Change
¥13,338 ¥22,103 ¥8,764
Primarily due to the temporary difference in valuation
allowance of movie assets, etc., assumed from the former
SQUARE being dissolved, accrued expenses increased
¥8,681 million. As a result, total liabilities at fiscal 2005
year-end were ¥22,103 million.
As of fiscal 2005 year-end, we had no interest-bearing
liabilities.
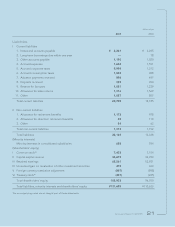
Shareholders’ Equity
Years ended March 31 Millions of yen
2004 2005 Change
Common stock ¥07,154 ¥007,433 ¥00,278
Capital surplus reserve 36,393 36,673 280
Retained earnings 53,931 65,561 11,630
Unrealized gain on revaluation
of securities 363 472 108
Foreign currency translation
adjustment (898) (807) 90
Treasury stock (245) (401) (156)
Total shareholders’ equity ¥96,700 ¥108,933 ¥12,232
As of fiscal 2005 year-end, total shareholders’ equity totaled
¥108,933 million, an increase of ¥12,232 million. The increase
in common stock and capital surplus reserve is due to stock
options being exercised.
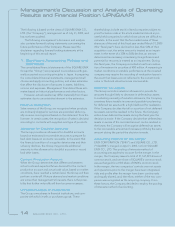
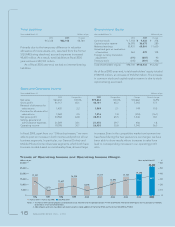
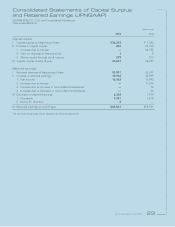
Sales and Operating Income
Years ended March 31 Millions of yen
2004 Composition 2005 Composition Change Percent change
Net sales ¥63,202 100.0% ¥73,864 100.0% ¥10,662 16.9%
Gross profit 41,117 65.1 48,161 65.2 7,043 17.1
Reversal of allowance for
sales returns 1,420 2.2 1,569 2.1 149 10.5
Provision for allowance for
sales returns 1,569 2.5 1,316 1.8 (253) (16.1)
Net gross profit 40,968 64.8 48,414 65.5 7,446 18.1
Selling, general and
administrative expenses 21,569 34.1 21,975 29.7 406 1.8
Operating income 19,398 30.7 26,438 35.8 7,040 36.3
In fiscal 2005, apart from our “Others businesses,” we were
able to post an increase in both income and profit in all our
business segments. In particular, our Games (Online) and
Mobile Phone Content business segments, which both have
business models based on membership fees, showed large
increases. Even in the competitive market environment we
have faced during the two years since our merger, we have
been able to show results where increases in sales have
lead to corresponding increases in our operating profit
ratio.
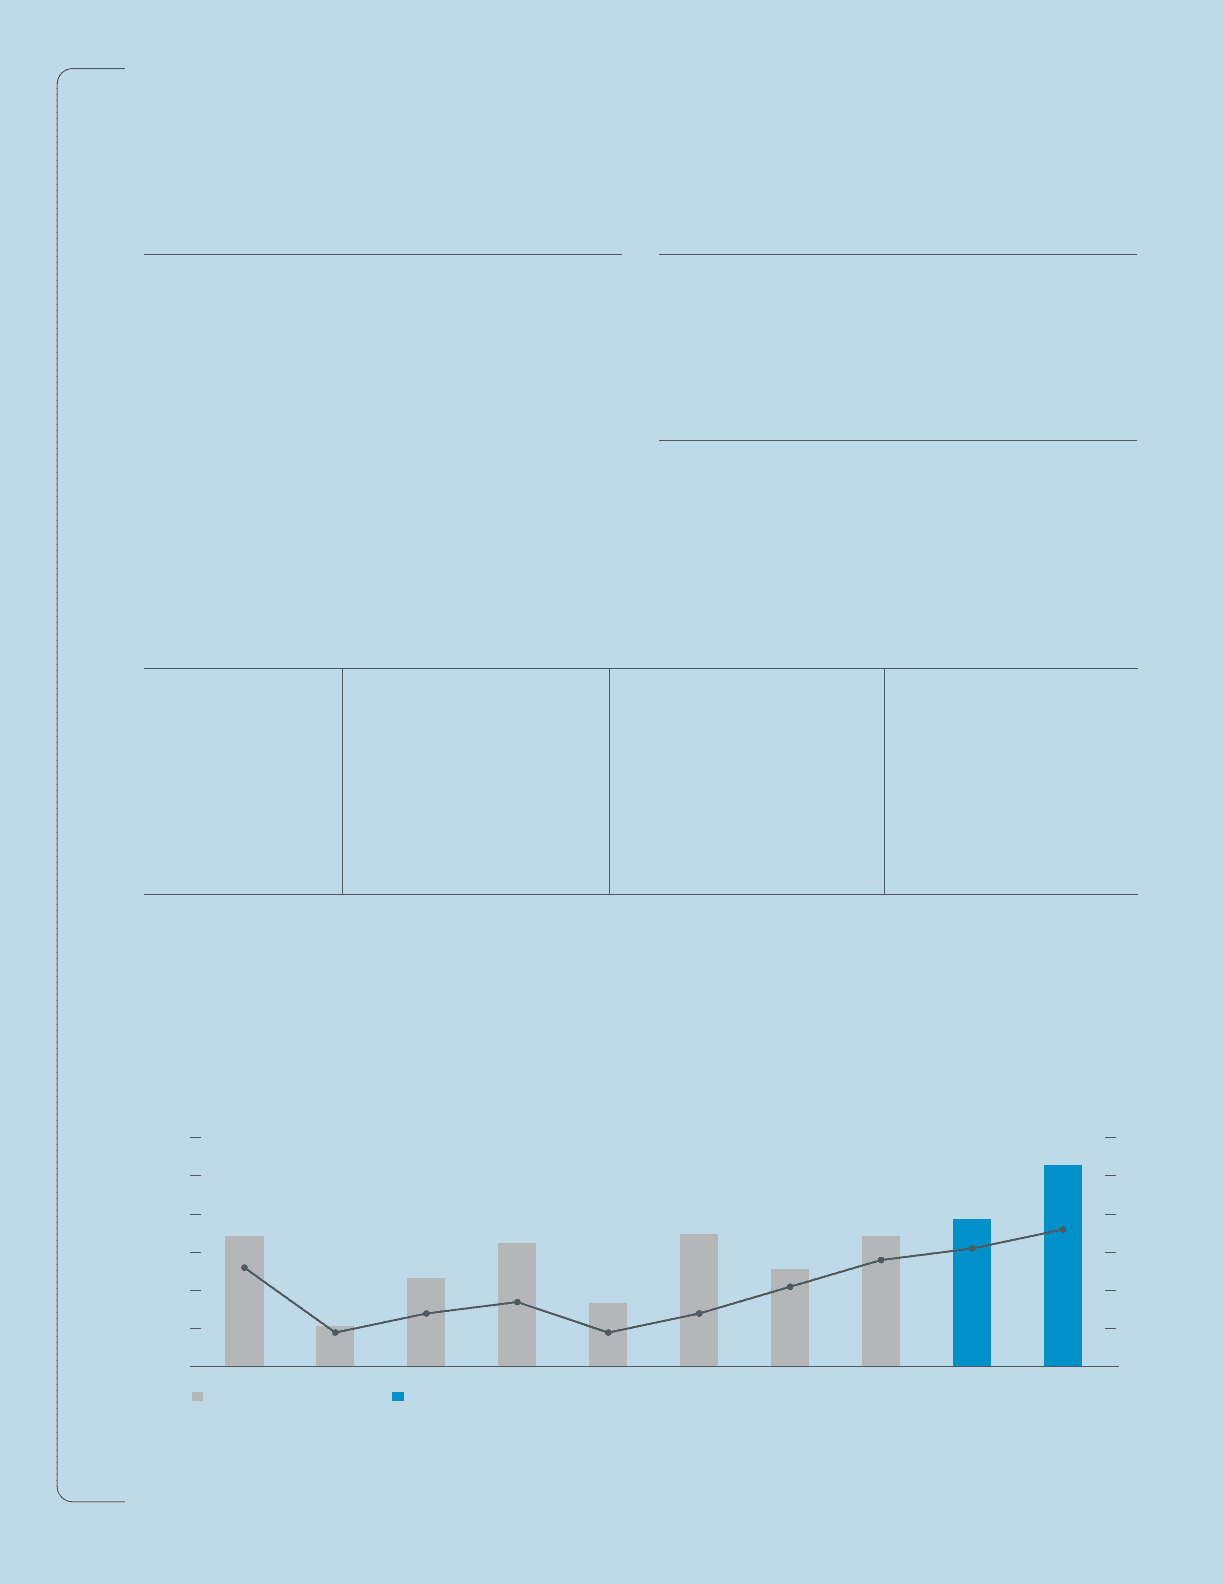
30,000
25,000
20,000
15,000
10,000
5,000
0
60
50
40
30
20
10
0
Millions of yen %Years ended March 31
Notes: 1. The former ENIX did not prepare consolidated financial statements for the period between FY1995 and FY2000. The former ENIX figures for this period are, therefore,
disclosed on a non-consolidated basis.
2. Above figures and ratios have been calculated using the simple addition of the former ENIX and the former SQUARE by FY2002.
1996 1997 1998 1999 2000 2001 2002 2003 2004 2005
Trends of Operating Income and Operating Income Margin
17,107
26%
5,370
9%
11,637
14%
16,224
17%
8,355
9%
17,411
14%
12,890
21%
17,197
28%
19,398
31%
26,438
36%
Former ENIX + Former SQUARE SQUARE ENIX