Square Enix 2005 Annual Report Download - page 24
Download and view the complete annual report
Please find page 24 of the 2005 Square Enix annual report below. You can navigate through the pages in the report by either clicking on the pages listed below, or by using the keyword search tool below to find specific information within the annual report.-
 1
1 -
2
-
3
-
4
-
5
-
6
-
7
-
8
-
9
-
10
-
11
-
12
-
13
-
 14
14 -
 15
15 -
 16
16 -
 17
17 -
 18
18 -
 19
19 -
 20
20 -
 21
21 -
 22
22 -
 23
23 -
 24
24 -
 25
25 -
 26
26 -
 27
27 -
 28
28 -
 29
29 -
 30
30 -
 31
31 -
 32
32 -
 33
33 -
 34
34 -
35
-
36
-
37
-
38
-
39
-
40
-
41
-
42
-
43
-
44
-
45
-
46
-
47
-
48
-
49
-
50
-
51
-
52
-
53
-
54
-
55
-
56
-
57
-
58
-
59
-
60
-
61
-
62
-
63
-
64
 |
 |

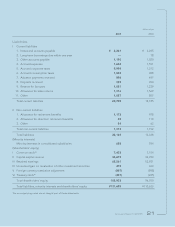
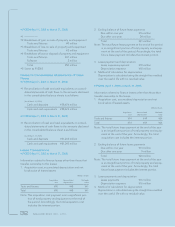
Consolidated Statements of Income (JPNGAAP)
SQUARE ENIX CO., LTD. and Consolidated Subsidiaries
Years ended March 31
22 SQUARE ENIX CO., LTD.
Millions of yen
2005 2004
I Net sales ¥73,864 ¥63,202
II Cost of sales 25,703 22,084
Gross profit 48,161 41,117
Reversal of allowance for sales returns 1,569 1,420
Provision for allowance for sales returns 1,316 1,569
Net gross profit 48,414 40,968
III Selling, general and administrative expenses*121,975 21,569
1. Packaging freight charge 634 545
2. Advertising expense 5,346 5,119
3. Sales promotion expense 109 660
4. Provision for doubtful accounts 77 332
5. Compensation for directors 233 231
6. Salary 4,251 3,887
7. Provision to reserve for bonuses 418 1,130
8. Net periodic pension costs 107 491
9. Provision to reserve for directors’ retirement benefits 121 6
10. Welfare expense 753 698
11. Rental expense 1,033 955
12. Commissions paid 2,667 3,023
13. Depreciation and amortization 1,141 1,179
14. Other 5,079 3,307
Operating income 26,438 19,398
IV Non-operating income 542 440
1. Interest income 72 67
2. Dividends received 478
3. Foreign exchange gain 296 —
4. Rental income 30 0
5. Miscellaneous income 138 294
V Non-operating expenses 1,080 1,590
1. Interest expenses 27
2. Foreign exchange loss —788
3. Stock issuance expense —8
4. Loss on disposal of inventories 3—
5. Loss on write-off of content development account 983 —
6. Equity on losses of non-consolidated subsidiaries and affiliates —760
7. Miscellaneous loss 90 25
Recurring income 25,901 18,248
VI Extraordinary gain 118 300
1. Gain on sale of property and equipment*20—
2. Gain on sale of investment securities 106 59
3. Gain on sale of shares in affiliates —240
4. Reversal of allowance for doubtful accounts 11 —
VII
Extraordinary loss 443 907
1. Loss on sale of property and equipment*32123
2. Loss on disposal of property and equipment*450 198
3. Evaluation loss on shares held in affiliates 145 125
4. Loss on evaluation of investment securities*580 375
5. Loss on sale of investment securities 284
6. Accelerated amortization of goodwill 145 —
7. Other 16 —
Income before income taxes and distribution of loss in partnership
(
tokumei-kumiai
)
25,576 17,640
Distribution of loss in partnership (
tokumei-kumiai
)20 24
Income before income taxes 25,556 17,616
Corporate, resident and enterprise taxes 11,267 3,600
Deferred income taxes (760) 2,962
Minority interest in consolidated subsidiaries 116 59
Net income ¥14,932 ¥10,993
The accompanying notes are an integral part of these statements.