Square Enix 2005 Annual Report Download - page 53
Download and view the complete annual report
Please find page 53 of the 2005 Square Enix annual report below. You can navigate through the pages in the report by either clicking on the pages listed below, or by using the keyword search tool below to find specific information within the annual report.-
 1
1 -
2
-
3
-
4
-
5
-
6
-
7
-
8
-
9
-
10
-
11
-
12
-
13
-
14
-
15
-
16
-
17
-
18
-
19
-
20
-
21
-
22
-
23
-
24
-
25
-
26
-
27
-
28
-
29
-
30
-
31
-
32
-
33
-
34
-
35
-
36
-
37
-
38
-
39
-
40
-
41
-
42
-
 43
43 -
 44
44 -
 45
45 -
 46
46 -
 47
47 -
 48
48 -
 49
49 -
 50
50 -
 51
51 -
 52
52 -
 53
53 -
 54
54 -
 55
55 -
 56
56 -
 57
57 -
 58
58 -
 59
59 -
 60
60 -
 61
61 -
 62
62 -
 63
63 -
64
 |
 |

51
Annual Report 2005
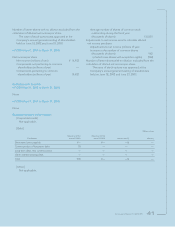
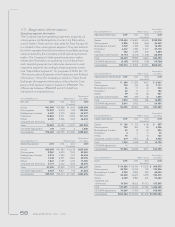
The following table summarizes the activity in options
under the plans:
Weighted-
Number average
of shares exercise price
Options outstanding—March 31, 2003 487,400 ¥2,374.92
Increase in option as a result of the merger
with SQUARE on April 1st, 2003 3,330,895 3,084.84
Granted—exercise price equal to fair value — —
Granted—exercise less than fair value — —
Exercise less than fair value 184,800 2,313.00
Forfeited 370,850 2,984.04
Options outstanding—March 31, 2004 3,262,645 ¥3,001.17
Granted—exercise price equal to fair value 580,000 2,981.00
Granted—exercise less than fair value — —
Exercised 255,125 2,186.14
Forfeited 328,745 2,964.57
Options outstanding—March 31, 2005 3,258,775 ¥3,065.08
At March 31, 2005, 2004 and 2003, the number of options
exercisable was 660,595, 723,397 and 185,945 (unaudited),
respectively, and their related weighted average exercise
prices were ¥3,065.08, ¥3,001.17 and ¥2,374.92 (unaudited),
respectively.
Had compensation cost for the Company’s stock option
plan been determined based on the fair value at the grant
date for awards in 2005, 2004 and 2003, consistent with the
provisions of SFAS No. 123, the Company’s net income and
the net income per share would have been reduced to the
pro forma amounts indicated below.
Thousands of
Millions of yen U.S. dollars
(Except share data)
Years ended March 31
2005 2004 2003 2005
(Unaudited)
Net income:
As reported ¥14,520 ¥4,355 ¥2,296 $135,207
Deduct: Total stock-based
employee compensation
expense determined
under fair value based
method for all awards 387 —453,600
Pro forma net income ¥14,133 ¥4,355 ¥2,251 $131,607
Earnings per share:
As reported—Basic ¥131.89 ¥39.58 ¥39.06 $1.23
Pro forma—Basic 128.38 — 38.28 1.20
As reported—Diluted ¥130.74 ¥37.99 ¥38.57 $1.22
Pro forma—Diluted 127.26 — 37.80 1.19
The pro forma disclosures shown are not representative
of the effects on net income and the net income per share
in future years.
The fair value of the Company’s stock options used to
compute pro forma net income and the net income per
share disclosures is the estimated present value at the grant
date using the Black–Scholes option-pricing model. The
weighted average fair values of options granted were
¥666.56 and ¥146.27 (unaudited) for the years ended March
31, 2005 and 2003. The following weighted average
assumptions for 2005 and 2003 were used to value grants:
expected volatilities of 28.33 percent and 44.65 percent
(unaudited); risk-free interest rates of 0.175 percent and
0.029 percent (unaudited); and expected holding periods
of 4.8 years and 0.68 years (unaudited).
Earnings Per Share
Basic earnings per share (“EPS”) are computed by dividing
the net income (loss) applicable to common stockholders
for the year by the weighted-average number of common
shares outstanding during the year. Diluted EPS is com-
puted by dividing the net income (loss) applicable to com-
mon stockholders for the year by the weighted-average
number of common and common stock equivalents, which
include common shares issuable upon the exercise of stock
options outstanding during the year. Common stock equiv-
alents are excluded from the computation if their effect is
antidilutive.
Comprehensive Income (Loss)
Comprehensive income (loss) represents change in net
assets of a business enterprise during a period from trans-
actions and other events and circumstances from non-owner
sources. Comprehensive income (loss) of the Company
includes net income adjusted for the change in foreign
currency translation adjustments and the change in net
unrealized gains (losses) from investments.
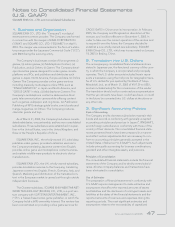
Foreign Currency Translation and Transactions
The functional currency for the Company’s foreign opera-
tions is the applicable local currency. Accounts of foreign
operations are translated into Japanese yen using period-
end exchange rates for assets and liabilities at the balance
sheet date and average prevailing exchange rates for the
period for revenue and expense accounts. Adjustments
resulting from translation are included in other comprehen-
sive income (loss). Realized and unrealized transaction gains
and losses are included in income in the period in which
they occur.
Reclassifications
Certain prior year amounts have been reclassified to con-
form to current year presentation.