Samsung 2004 Annual Report Download - page 67
Download and view the complete annual report
Please find page 67 of the 2004 Samsung annual report below. You can navigate through the pages in the report by either clicking on the pages listed below, or by using the keyword search tool below to find specific information within the annual report.-
 1
1 -
2
-
3
-
4
-
5
-
6
-
7
-
8
-
9
-
10
-
11
-
12
-
13
-
14
-
15
-
16
-
17
-
18
-
19
-
20
-
21
-
22
-
23
-
24
-
25
-
26
-
27
-
28
-
29
-
30
-
31
-
32
-
33
-
34
-
35
-
36
-
37
-
38
-
39
-
40
-
41
-
42
-
43
-
44
-
45
-
46
-
47
-
48
-
49
-
50
-
51
-
52
-
53
-
54
-
55
-
56
-
 57
57 -
 58
58 -
 59
59 -
 60
60 -
 61
61 -
 62
62 -
 63
63 -
 64
64 -
 65
65 -
 66
66 -
 67
67 -
 68
68 -
 69
69 -
 70
70 -
 71
71 -
 72
72 -
 73
73 -
 74
74 -
 75
75 -
 76
76
 |
 |

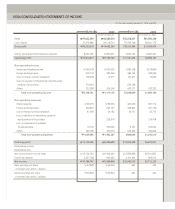
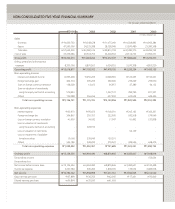
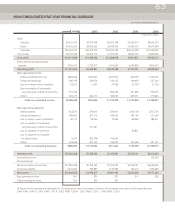
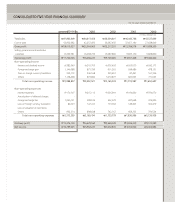
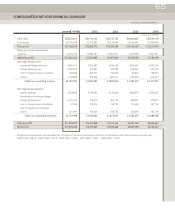
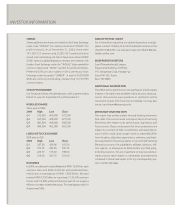
CONSOLIDATED FIVE-YEAR FINANCIAL SUMMARY
In thousands of U.S. dollars
For the years ended December 31
Total sales $78,523,672 $54,113,755 $48,737,755 $35,022,825 $34,554,105
Cost of sales 50,730,678 35,275,082 30,229,465 24,626,491 21,940,626
Gross profit
$
27,792,994
$
18,838,673
$
18,508,290
$
10,396,334
$
12,613,479
Selling, general and administrative
expenses 16,525,753 13,582,181 10,902,921 7,416,598 5,421,021
Operating profit
$
11,267,241
$
5,256,493
$
7,605,369
$
2,979,736
$
7,192,459
Non-operating income
Interest and dividend income $366,017 $259,395 $256,159 $154,645 $192,250
Foreign exchange gain 1,097,996 727,831 509,299 452,067 379,575
Gain on foreign currency translation 193,688 205,517 196,269 65,976 128,075
Others 1,109,885 729,554 842,117 624,338 612,077
Total non-operating income $2,767,587 $1,922,297 $1,803,843 $1,297,027 $1,311,977
Non-operating expenses
Interest expenses $162,969 $179,590 $214,028 $309,675 $436,667
Amortization of deferred charges - - - - -
Foreign exchange loss 1,015,703 758,070 460,121 458,237 378,602
Loss on foreign currency translation 77,336 123,073 144,755 112,663 287,703
Loss on valuation of inventories - - - - -
Others 921,991 750,249 618,766 504,679 595,796
Total non-operating expenses $2,177,999 $1,810,982 $1,437,670 $1,385,255 $1,698,768
Ordinary profit
$
11,856,829
$
5,367,808
$
7,971,542
$
2,891,508
$
6,805,667
Net income
$
10,336,784
$
4,977,665 $5,875,404 $2,303,798 $4,765,327
All figures in this summary are translated into US dollars at the rate of exchange in effect as of the balance sheet date of each respective year.
2004: KRW 1,043.8 2003: KRW 1,197.8 2002: KRW 1,200.4 2001: KRW 1,326.1 2000: KRW 1,259.7
65
2004 2003 2002 2001 2000