Samsung 2004 Annual Report Download - page 62
Download and view the complete annual report
Please find page 62 of the 2004 Samsung annual report below. You can navigate through the pages in the report by either clicking on the pages listed below, or by using the keyword search tool below to find specific information within the annual report.-
 1
1 -
2
-
3
-
4
-
5
-
6
-
7
-
8
-
9
-
10
-
11
-
12
-
13
-
14
-
15
-
16
-
17
-
18
-
19
-
20
-
21
-
22
-
23
-
24
-
25
-
26
-
27
-
28
-
29
-
30
-
31
-
32
-
33
-
34
-
35
-
36
-
37
-
38
-
39
-
40
-
41
-
42
-
43
-
44
-
45
-
46
-
47
-
48
-
49
-
50
-
51
-
 52
52 -
 53
53 -
 54
54 -
 55
55 -
 56
56 -
 57
57 -
 58
58 -
 59
59 -
 60
60 -
 61
61 -
 62
62 -
 63
63 -
 64
64 -
 65
65 -
 66
66 -
 67
67 -
 68
68 -
 69
69 -
 70
70 -
 71
71 -
 72
72 -
73
-
74
-
75
-
76
 |
 |
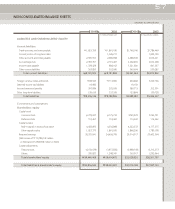
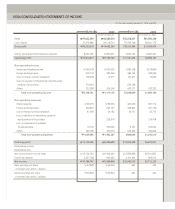
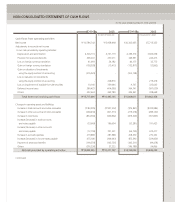
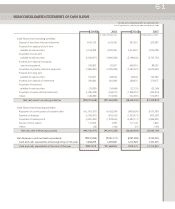
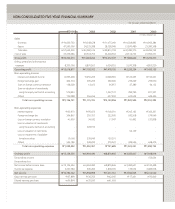
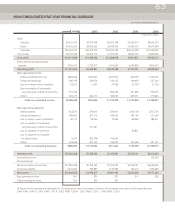
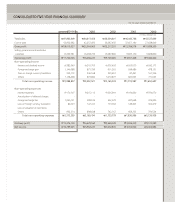
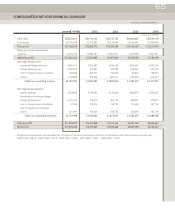
NON-CONSOLIDATED STATEMENTS OF CASH FLOWS
In millions of Korean won In thousands of U.S. dollars
For the years ended December 31, 2004 and 2003
Cash flows from operating activities
Net income ₩10,786,742 ₩5,958,998 $10,342,035 $5,713,325
Adjustments to reconcile net income
to net cash provided by operating activities:
Depreciation and amortization 4,526,115 3,761,119 4,339,516 3,606,058
Provision for severance benefits 365,041 257,011 349,991 246,415
Loss on foreign currency translation 41,903 34,182 40,175 32,773
Gain on foreign currency translation (138,528) (13,415) (132,817) (12,862)
Gain on valuation of investments
using the equity method of accounting (576,923) - (553,138) -
Loss on valuation on investments
using the equity method of accounting - 228,916 - 219,478
Loss on impairment of available-for-sale securities 10,166 339,646 9,747 325,643
Deferred income taxes 380,425 (414,092) 364,741 (397,020)
Others 322,663 342,780 309,361 328,648
Total items not involving cash flows
₩
15,717,604
₩
10,495,145 $15,069,611 $10,062,458
Changes in operating assets and liabilities:
Increase in trade accounts and notes receivable (₩83,295) (₩347,302) ($79,861) ($332,984)
Increase in other accounts and notes receivable (228,436) (301,573) (219,018) (289,140)
Increase in inventories (854,560) (366,962) (819,329) (351,833)
Increase (Decrease) in trade accounts
and notes payable (33,669) 199,654 (32,281) 191,423
Increase (Decrease) in other accounts
and notes payable (72,759) 701,331 (69,759) 672,417
Increase in accrued expenses 279,889 281,988 268,350 270,362
Increase (Decrease) in income taxes payable 475,180 (344,043) 455,590 (329,859)
Payment of severance benefits (190,359) (103,756) (182,511) (99,478)
Others (205,250) 57,225 (196,789) 54,866
Net cash provided by operating activities
₩
14,804,345
₩
10,271,707 $14,194,003 $9,848,232
Continued;
2004 2003 2004 2003