Samsung 2004 Annual Report Download - page 59
Download and view the complete annual report
Please find page 59 of the 2004 Samsung annual report below. You can navigate through the pages in the report by either clicking on the pages listed below, or by using the keyword search tool below to find specific information within the annual report.-
 1
1 -
2
-
3
-
4
-
5
-
6
-
7
-
8
-
9
-
10
-
11
-
12
-
13
-
14
-
15
-
16
-
17
-
18
-
19
-
20
-
21
-
22
-
23
-
24
-
25
-
26
-
27
-
28
-
29
-
30
-
31
-
32
-
33
-
34
-
35
-
36
-
37
-
38
-
39
-
40
-
41
-
42
-
43
-
44
-
45
-
46
-
47
-
48
-
 49
49 -
 50
50 -
 51
51 -
 52
52 -
 53
53 -
 54
54 -
 55
55 -
 56
56 -
 57
57 -
 58
58 -
 59
59 -
 60
60 -
 61
61 -
 62
62 -
 63
63 -
 64
64 -
 65
65 -
 66
66 -
 67
67 -
 68
68 -
 69
69 -
70
-
71
-
72
-
73
-
74
-
75
-
76
 |
 |
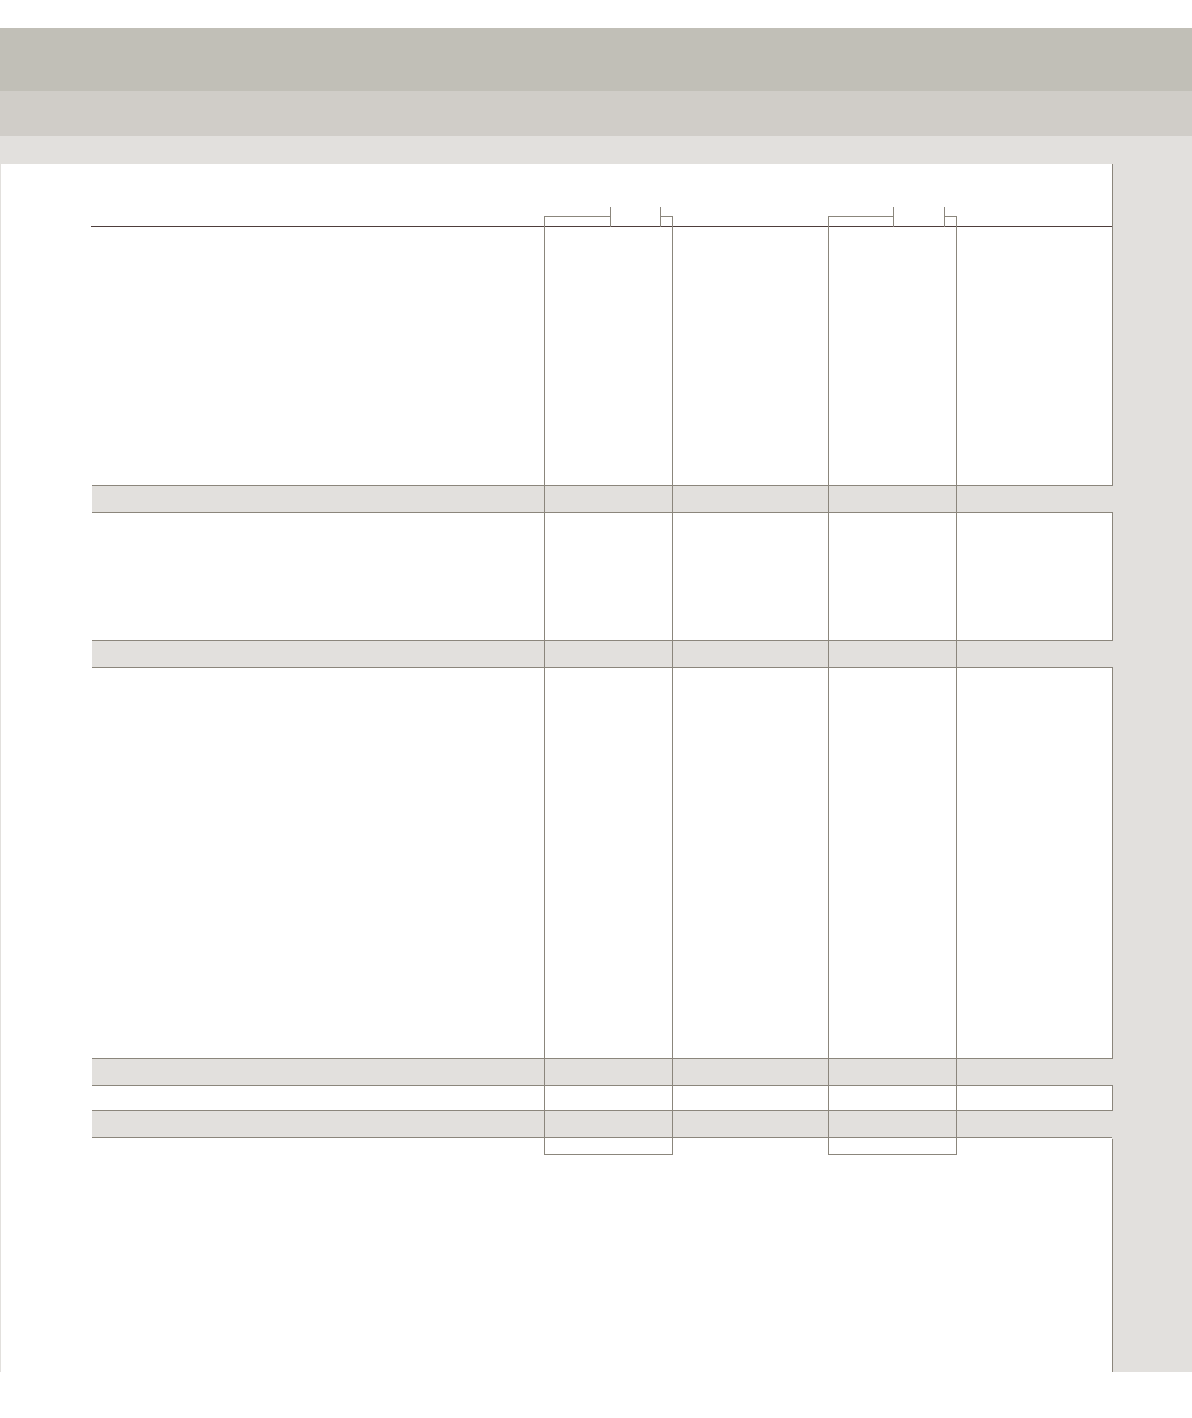
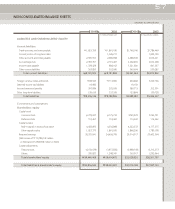
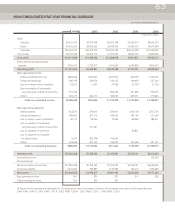
NON-CONSOLIDATED BALANCE SHEETS
December 31, 2004 and 2003
In millions of Korean won In thousands of U.S. dollars
LIABILITIES AND SHAREHOLDERS’ EQUITY
Current liabilities
Trade accounts and notes payable ₩1,823,316 ₩1,861,180 $1,748,146 $1,784,449
Current portion of long-term debt - 1,045,211 - 1,002,120
Other accounts and notes payable 2,595,557 2,686,998 2,488,549 2,576,221
Accrued expenses 2,359,751 2,161,407 2,262,465 2,072,298
Income taxes payable 1,378,429 884,012 1,321,600 847,567
Other current liabilities 563,850 553,090 540,604 530,287
Total current liabilities
₩
8,720,903
₩
9,191,898 $8,361,364 $8,812,942
Foreign currency notes and bonds ₩98,545 ₩113,860 $94,482 $109,166
Deferred income tax liabilities 19,983 - 19,159 -
Accrued severance benefits 397,084 325,939 380,713 312,501
Other long-term liabilities 139,619 157,209 133,864 150,728
Total liabilities
₩
9,376,134
₩
9,788,906 $8,989,582 $9,385,337
Commitments and contingencies
Shareholders’ equity
Capital stock:
Common stock ₩778,047 ₩775,774 $745,970 $743,791
Preferred stock 119,467 119,467 114,542 114,542
Capital surplus:
Paid-in capital in excess of par value 4,403,893 4,356,898 4,222,333 4,177,275
Other capital surplus 1,927,773 1,861,920 1,848,296 1,785,158
Retained earnings: 30,575,041 24,409,709 29,314,517 23,403,364
(Net income of ₩10,786,742 million
in 2004 and ₩5,958,998 million in 2003)
Capital adjustments:
Treasury stock (4,159,639) (3,457,834) (3,988,149) (3,315,277)
Others 795,827 1,348,541 763,017 1,292,944
Total shareholders’ equity
₩
34,440,409
₩
29,414,475 $33,020,526 $28,201,797
Total liabilities & shareholder’s equity
₩
43,816,543
₩
39,203,381 $42,010,108 $37,587,134
57
2004 2003 2004 2003