Samsung 2004 Annual Report Download - page 65
Download and view the complete annual report
Please find page 65 of the 2004 Samsung annual report below. You can navigate through the pages in the report by either clicking on the pages listed below, or by using the keyword search tool below to find specific information within the annual report.-
 1
1 -
2
-
3
-
4
-
5
-
6
-
7
-
8
-
9
-
10
-
11
-
12
-
13
-
14
-
15
-
16
-
17
-
18
-
19
-
20
-
21
-
22
-
23
-
24
-
25
-
26
-
27
-
28
-
29
-
30
-
31
-
32
-
33
-
34
-
35
-
36
-
37
-
38
-
39
-
40
-
41
-
42
-
43
-
44
-
45
-
46
-
47
-
48
-
49
-
50
-
51
-
52
-
53
-
54
-
 55
55 -
 56
56 -
 57
57 -
 58
58 -
 59
59 -
 60
60 -
 61
61 -
 62
62 -
 63
63 -
 64
64 -
 65
65 -
 66
66 -
 67
67 -
 68
68 -
 69
69 -
 70
70 -
 71
71 -
 72
72 -
 73
73 -
 74
74 -
 75
75 -
76
 |
 |

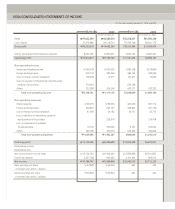
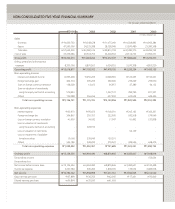
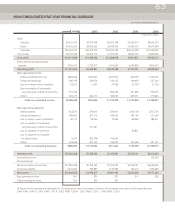
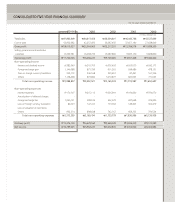
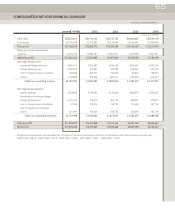
NON-CONSOLIDATED FIVE-YEAR FINANCIAL SUMMARY
In thousands of U.S. dollars
For the years ended December 31
Sales
Domestic $9,622,975 $7,810,048 $9,252,348 $7,926,014 $8,660,353
Export 45,633,362 28,599,322 24,008,395 16,493,575 18,570,586
Total sales $55,256,337 $36,409,370 $33,260,743 $24,419,589 $27,230,939
Cost of sales 35,742,748 24,660,612 21,972,065 18,487,732 17,468,926
Gross profit
$
19,513,589
$
11,748,758
$
11,288,678
$
5,931,857
$
9,762,013
Selling, general and administrative
expenses 7,992,135 5,739,817 5,041,230 4,200,836 3,856,410
Operating profit
$
11,521,454
$
6,008,941
$
6,247,448
$
1,731,021
$
5,905,603
Non-operating income
Interest and dividend income $283,248 $209,027 $207,670 $95,365 $124,247
Foreign exchange gain 386,169 246,674 244,525 180,429 237,546
Gain on foreign currency translation 132,817 11,207 47,583 35,736 27,102
Gain on valuation of investments
using the equity method of accounting 553,138 - 892,040 591,848 692,079
Others 693,277 464,717 382,581 469,551 515,843
Total non-operating income $2,048,649 $931,625 $1,774,399 $1,372,929 $1,596,817
Non-operating expenses
Interest expense $63,250 $79,913 $83,961 $154,709 $272,730
Foreign exchange loss 349,825 297,216 186,220 183,196 221,643
Loss on foreign currency translation 40,175 28,556 14,659 68,999 188,911
Loss on valuation of investments
using the equity method of accounting - 191,241 - - -
Loss on valuation of inventories - - - 40,821
Loss on impairment of available
for-sale securities 9,747 283,748 100,426 - -
Others 523,668 291,730 226,000 331,484 507,131
Total non-operating expenses $986,665 $1,172,404 $611,266 $779,209 $1,190,415
Ordinary profit
$
12,583,438
$
5,768,162
$
7,410,581
$
2,324,741
$
6,312,005
Extraordinary income - - - - 122,029
Extraordinary loss - - - - -
Net income before income taxes $12,583,438 $5,768,162 $7,410,581 $2,324,741 $6,434,034
Income tax expense 2,241,403 789,885 1,519,386 102,316 1,656,806
Net income
$
10,342,035
$
4,978,277
$
5,891,195
$
2,222,425
$
4,777,228
Basic earnings per share $65 $30 $35 $13 $28
Diluted earnings per share $64 $30 $35 - -
All figures in this summary are translated into US dollars at the rate of exchange in effect as of the balance sheet date of each respective year.
2004: KRW 1,043.8 2003: KRW 1,197.8 2002: KRW 1,200.4 2001: KRW 1,326.1 2000: KRW 1,259.7
63
2004 2003 2002 2001 2000