Samsung 2004 Annual Report Download - page 66
Download and view the complete annual report
Please find page 66 of the 2004 Samsung annual report below. You can navigate through the pages in the report by either clicking on the pages listed below, or by using the keyword search tool below to find specific information within the annual report.-
 1
1 -
2
-
3
-
4
-
5
-
6
-
7
-
8
-
9
-
10
-
11
-
12
-
13
-
14
-
15
-
16
-
17
-
18
-
19
-
20
-
21
-
22
-
23
-
24
-
25
-
26
-
27
-
28
-
29
-
30
-
31
-
32
-
33
-
34
-
35
-
36
-
37
-
38
-
39
-
40
-
41
-
42
-
43
-
44
-
45
-
46
-
47
-
48
-
49
-
50
-
51
-
52
-
53
-
54
-
55
-
 56
56 -
 57
57 -
 58
58 -
 59
59 -
 60
60 -
 61
61 -
 62
62 -
 63
63 -
 64
64 -
 65
65 -
 66
66 -
 67
67 -
 68
68 -
 69
69 -
 70
70 -
 71
71 -
 72
72 -
 73
73 -
 74
74 -
 75
75 -
 76
76
 |
 |
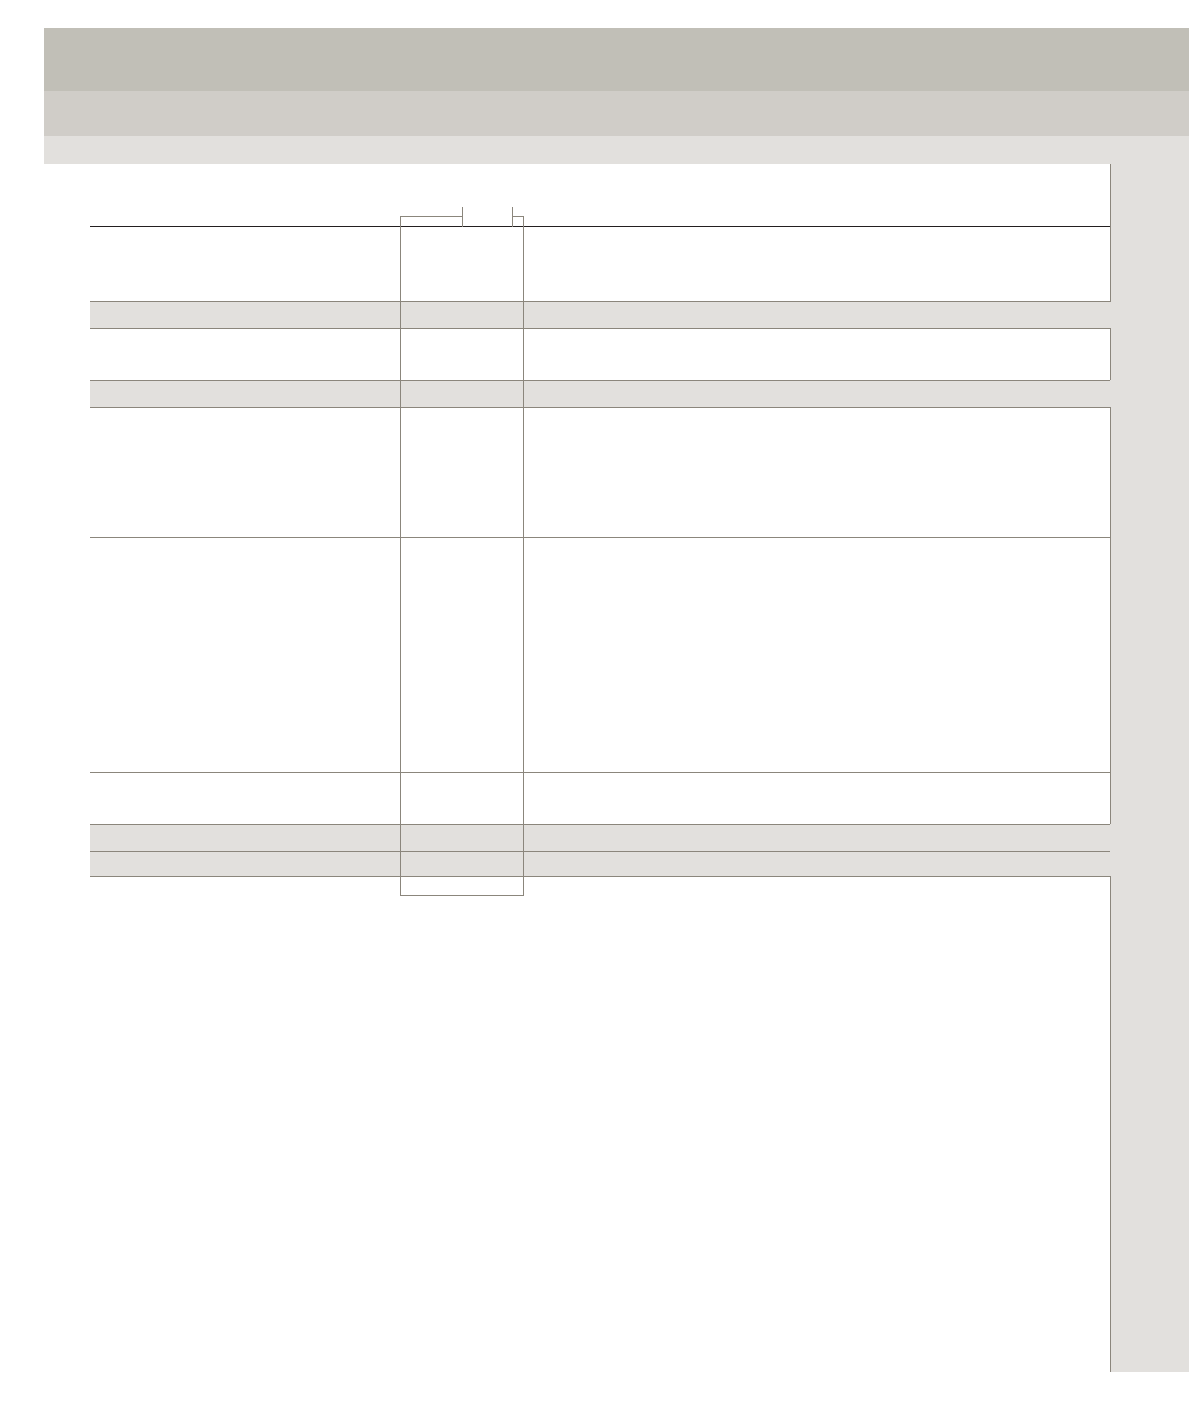
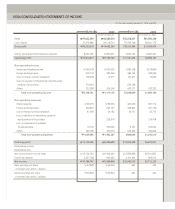
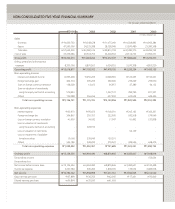
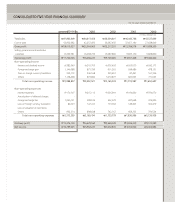
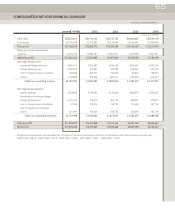
CONSOLIDATED FIVE-YEAR FINANCIAL SUMMARY
In millions of Korean won
For the years ended December 31
Total sales ₩81,963,009 ₩64,817,456 ₩58,504,801 ₩46,443,768 ₩43,527,806
Cost of sales 52,952,682 42,252,493 36,287,450 32,657,190 27,638,606
Gross profit ₩29,010,327 ₩22,564,963 ₩22,217,351 ₩13,786,578 ₩15,889,200
Selling, general and administrative
expenses 17,249,581 16,268,736 13,087,866 9,835,150 6,828,860
Operating profit ₩11,760,746 ₩6,296,227 ₩9,129,485 ₩3,951,428 ₩9,060,340
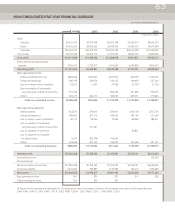
Non-operating income
Interest and dividend income ₩382,049 ₩310,703 ₩307,493 ₩205,075 ₩242,177
Foreign exchange gain 1,146,088 871,796 611,362 599,486 478,151
Gain on foreign currency translation 202,172 246,168 235,601 87,491 161,336
Others 1,158,498 873,860 1,010,877 827,935 771,033
Total non-operating income
₩
2,888,807
₩
2,302,527
₩
2,165,333
₩
1,719,987
₩
1,652,697
Non-operating expenses
Interest expenses ₩170,107 ₩215,113 ₩256,919 ₩410,660 ₩550,070
Amortization of deferred charges - - - - -
Foreign exchange loss 1,060,191 908,016 552,329 607,668 476,925
Loss on foreign currency translation 80,723 147,417 173,764 149,403 362,419
Loss on valuation of inventories - - - - -
Others 962,374 898,648 742,767 669,255 750,524
Total non-operating expenses
₩
2,273,395
₩
2,169,194
₩
1,725,779
₩
1,836,986
₩
2,139,938
Ordinary profit ₩12,376,158 ₩6,429,560 ₩9,569,039 ₩3,834,429 ₩8,573,099
Net income ₩10,789,535 ₩5,962,247 ₩7,052,835 ₩3,055,066 ₩6,002,882
2004 2003 2002 2001 2000