Samsung 2004 Annual Report Download - page 63
Download and view the complete annual report
Please find page 63 of the 2004 Samsung annual report below. You can navigate through the pages in the report by either clicking on the pages listed below, or by using the keyword search tool below to find specific information within the annual report.-
 1
1 -
2
-
3
-
4
-
5
-
6
-
7
-
8
-
9
-
10
-
11
-
12
-
13
-
14
-
15
-
16
-
17
-
18
-
19
-
20
-
21
-
22
-
23
-
24
-
25
-
26
-
27
-
28
-
29
-
30
-
31
-
32
-
33
-
34
-
35
-
36
-
37
-
38
-
39
-
40
-
41
-
42
-
43
-
44
-
45
-
46
-
47
-
48
-
49
-
50
-
51
-
52
-
 53
53 -
 54
54 -
 55
55 -
 56
56 -
 57
57 -
 58
58 -
 59
59 -
 60
60 -
 61
61 -
 62
62 -
 63
63 -
 64
64 -
 65
65 -
 66
66 -
 67
67 -
 68
68 -
 69
69 -
 70
70 -
 71
71 -
 72
72 -
 73
73 -
74
-
75
-
76
 |
 |
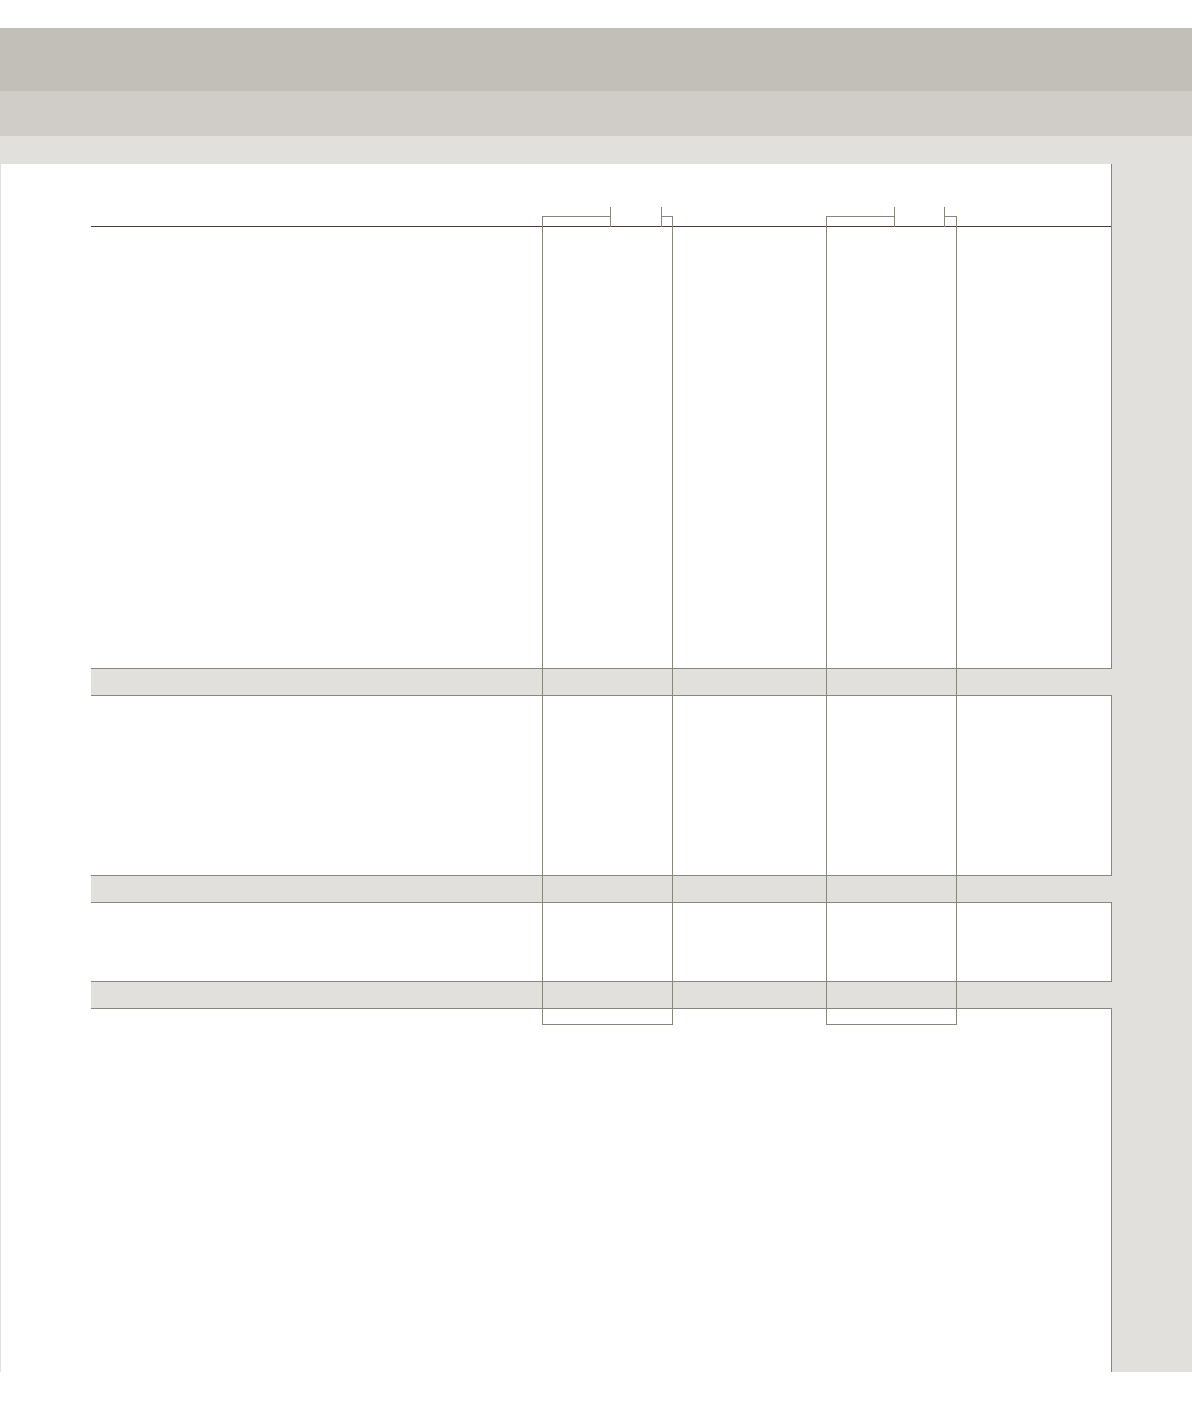
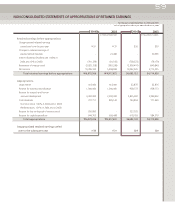
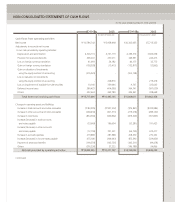
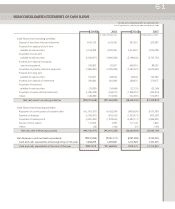
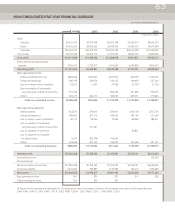
NON-CONSOLIDATED STATEMENTS OF CASH FLOWS
For the years ended December 31, 2004 and 2003
Date of appropriations; February 28, 2005 and February 27, 2004
In millions of Korean won In thousands of U.S. dollars
2004 2003 2004 2003
Cash flows from investing activities
Disposal of short-term financial instruments ₩60,130 ₩26,166 $57,651 $25,087
Proceeds from disposal of short-term
available-for-sale securities 2,518,498 3,209,090 2,414,667 3,076,788
Acquisition of short-term
available-for-sale securities (2,292,871) (3,896,389) (2,198,342) (3,735,752)
Proceeds from disposal of property,
plant and equipment 520,865 92,057 499,391 88,262
Acquisition of property, plant and equipment (7,869,985) (6,789,358) (7,545,527) (6,509,452)
Proceeds from long-term
available-for-sale securities 102,667 148,504 98,434 142,382
Proceeds from disposal of investments 300,840 281,688 288,437 270,075
Acquisition of long-term
available-for-sale securities (23,083) (54,444) (22,131) (52,199)
Acquisition of equity-method investments (1,980,439) (244,911) (1,898,791) (234,814)
Others (128,280) (114,992) (122,991) (110,251)
Net cash used in investing activities (
₩
8,791,658) (
₩
7,342,589) ($8,429,202) ($7,039,874)
Cash flows from financing activities
Repayment of current portion of long-term debt (₩1,001,207) (₩183,340) ($959,930) ($175,781)
Payment of dividends (1,596,281) (910,192) (1,530,471) (872,667)
Acquisition of treasury stock (3,841,485) (1,978,562) (3,683,111) (1,896,991)
Exercise of stock options 115,924 1,909 111,145 1,830
Others (28) (104) (27) (100)
Net cash used in financing activities (₩6,323,077) (₩3,070,289) (
$
6,062,394) (
$
2,943,709)
Net decrease in cash and cash equivalents (
₩
310,390) (
₩
141,171) ($297,593) ($135,351)
Cash and cash equivalents at the beginning of the year 1,268,209 1,409,380 1,215,924 1,351,275
Cash and cash equivalents at the end of the year
₩
957,819
₩
1,268,209 $918,331 $1,215,924
61