Samsung 2004 Annual Report Download - page 64
Download and view the complete annual report
Please find page 64 of the 2004 Samsung annual report below. You can navigate through the pages in the report by either clicking on the pages listed below, or by using the keyword search tool below to find specific information within the annual report.-
 1
1 -
2
-
3
-
4
-
5
-
6
-
7
-
8
-
9
-
10
-
11
-
12
-
13
-
14
-
15
-
16
-
17
-
18
-
19
-
20
-
21
-
22
-
23
-
24
-
25
-
26
-
27
-
28
-
29
-
30
-
31
-
32
-
33
-
34
-
35
-
36
-
37
-
38
-
39
-
40
-
41
-
42
-
43
-
44
-
45
-
46
-
47
-
48
-
49
-
50
-
51
-
52
-
53
-
 54
54 -
 55
55 -
 56
56 -
 57
57 -
 58
58 -
 59
59 -
 60
60 -
 61
61 -
 62
62 -
 63
63 -
 64
64 -
 65
65 -
 66
66 -
 67
67 -
 68
68 -
 69
69 -
 70
70 -
 71
71 -
 72
72 -
 73
73 -
 74
74 -
75
-
76
 |
 |

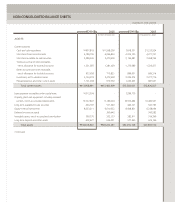
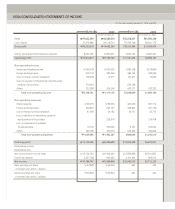
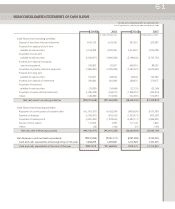
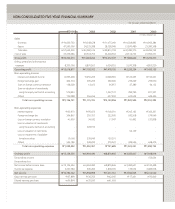
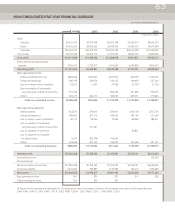
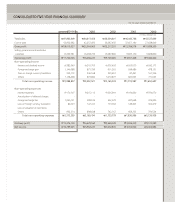
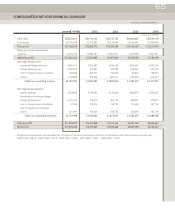
NON-CONSOLIDATED FIVE-YEAR FINANCIAL SUMMARY
In millions of Korean won
For the years ended December 31
Sales
Domestic ₩10,036,763 ₩9,348,628 ₩11,075,060 ₩10,509,895 ₩10,903,384
Export 47,595,596 34,233,388 28,738,049 21,870,480 23,380,368
Total sales ₩57,632,359 ₩43,582,016 ₩39,813,109 ₩32,380,375 ₩34,283,752
Cost of sales 37,279,686 29,518,753 26,300,562 24,514,733 21,993,377
Gross profit ₩20,352,673 ₩14,063,263 ₩13,512,547 ₩7,865,642 ₩12,290,375
Selling, general and administrative
expenses 8,335,796 6,870,561 6,034,352 5,570,308 4,855,220
Operating profit ₩12,016,877 ₩7,192,702 ₩7,478,195 ₩2,295,334 ₩7,435,155
Non-operating income
Interest and dividend income ₩295,428 ₩250,205 ₩248,581 ₩126,455 ₩156,427
Foreign exchange gain 402,774 295,269 292,696 239,249 299,070
Gain on foreign currency translation 138,528 13,415 56,957 47,386 34,122
Gain on valuation of investments
using the equity method of accounting 576,923 - 1,067,772 784,790 871,327
Others 723,088 556,266 457,950 622,624 649,446
Total non-operating income
₩
2,136,741
₩
1,115,155
₩
2,123,956
₩
1,820,504
₩
2,010,392
Non-operating expenses
Interest expense ₩65,970 ₩95,656 ₩100,501 ₩205,145 ₩343,367
Foreign exchange loss 364,867 355,767 222,905 242,918 279,049
Loss on foreign currency translation 41,903 34,182 17,547 91,492 237,838
Loss on valuation of investments
using the equity method of accounting - 228,916 - - -
Loss on valuation of inventories - - - 54,129 -
Loss on impairment of available-
for-sale securities 10,166 339,646 120,210 - -
Others 546,186 349,200 270,522 439,546 638,479
Total non-operating expenses
₩
1,029,092
₩
1,403,367
₩
731,685
₩
1,033,231
₩
1,498,733
Ordinary profit ₩13,124,526 ₩6,904,490 ₩8,870,466 ₩3,082,607 ₩7,946,814
Extraordinary income - - - - 153,634
Extraordinary loss - - - - -
Net income before income taxes ₩13,124,526 ₩6,904,490 ₩8,870,466 ₩3,082,607 ₩8,100,448
Income tax expense 2,337,784 945,492 1,818,705 135,672 2,085,918
Net income ₩10,786,742 ₩5,958,998 ₩7,051,761 ₩2,946,935 ₩6,014,530
Basic earnings per share ₩67,899 ₩36,356 ₩42,005 ₩17,461 ₩35,006
Diluted earnings per share ₩66,864 ₩35,930 ₩41,603 - -
2004 2003 2002 2001 2000