Salesforce.com 2009 Annual Report Download - page 81
Download and view the complete annual report
Please find page 81 of the 2009 Salesforce.com annual report below. You can navigate through the pages in the report by either clicking on the pages listed below, or by using the keyword search tool below to find specific information within the annual report.-
 1
1 -
2
-
3
-
4
-
5
-
6
-
7
-
8
-
9
-
10
-
11
-
12
-
13
-
14
-
15
-
16
-
17
-
18
-
19
-
20
-
21
-
22
-
23
-
24
-
25
-
26
-
27
-
28
-
29
-
30
-
31
-
32
-
33
-
34
-
35
-
36
-
37
-
38
-
39
-
40
-
41
-
42
-
43
-
44
-
45
-
46
-
47
-
48
-
49
-
50
-
51
-
52
-
53
-
54
-
55
-
56
-
57
-
58
-
59
-
60
-
61
-
62
-
63
-
64
-
65
-
66
-
67
-
68
-
69
-
70
-
 71
71 -
 72
72 -
 73
73 -
 74
74 -
 75
75 -
 76
76 -
 77
77 -
 78
78 -
 79
79 -
 80
80 -
 81
81 -
 82
82 -
 83
83 -
 84
84 -
 85
85 -
 86
86 -
 87
87 -
 88
88 -
 89
89 -
 90
90 -
 91
91 -
92
-
93
-
94
-
95
-
96
-
97
-
98
-
99
-
100
-
101
-
102
-
103
-
104
-
105
-
106
-
107
-
108
-
109
-
110
-
111
-
112
-
113
-
114
-
115
-
116
-
117
-
118
-
119
-
120
-
121
-
122
-
123
 |
 |
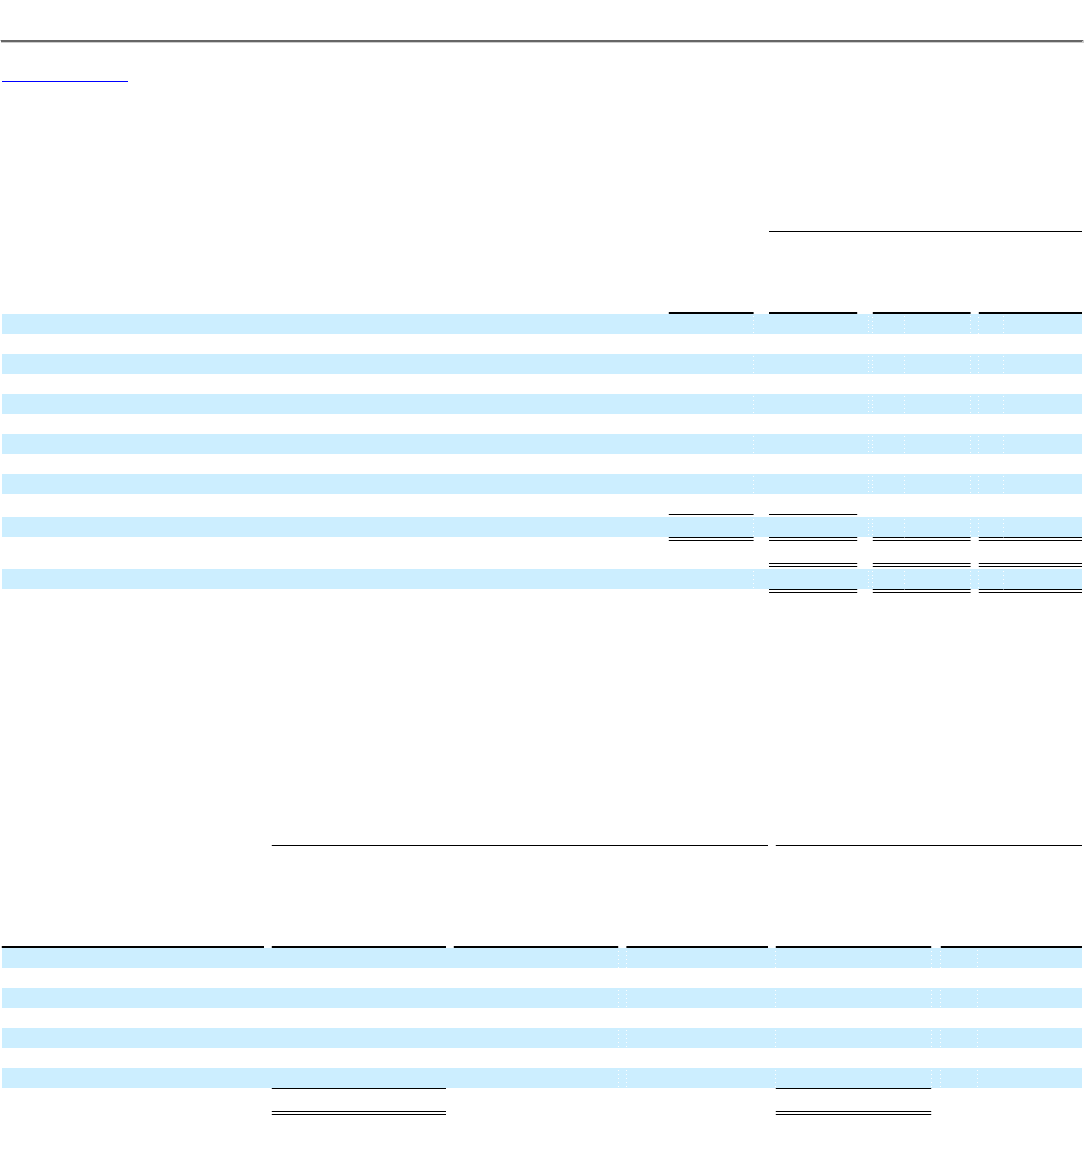
Table of Contents
salesforce.com, inc.
Notes to Consolidated Financial Statements—(Continued)
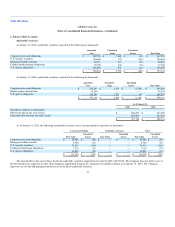
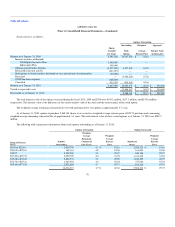
Stock activity is as follows:
Shares
Available
for Grant
Options Outstanding
Outstanding
Stock
Options
Weighted-
Average
Exercise Price
Aggregate
Intrinsic Value
(in thousands)
Balance as of January 31, 2009 4,191,642 14,917,520 $ 32.51
Increase in shares authorized:
2004 Equity Incentive Plan 3,500,000 — —
Inducement Plan 300,000
Options granted under all plans (3,477,039) 3,477,039 61.78
Restricted stock unit activity (623,227) — —
Stock grants to board members for board services and advisory board members (50,200) — —
Exercised — (3,422,626) 27.42
1999 Plan shares expired (168,809)
Cancelled 935,562 (935,562) 42.06
Balance as of January 31, 2010 4,607,929 14,036,371 $ 40.36 $ 332,052
Vested or expected to vest 13,485,927 $ 39.97 $ 324,090
Exercisable as of January 31, 2010 5,968,101 $ 29.73 $ 202,288
The total intrinsic value of the options exercised during the fiscal 2010, 2009 and 2008 were $105.2 million, $117.3 million, and $155.8 million
respectively. The intrinsic value is the difference of the current market value of the stock and the exercise price of the stock option.
The weighted-average remaining contractual life of vested and expected to vest options is approximately 3.7 years.
As of January 31, 2010, options to purchase 5,968,101 shares were vested at a weighted average exercise price of $29.73 per share and a remaining
weighted-average remaining contractual life of approximately 3.4 years. The total intrinsic value of these vested options as of January 31, 2010 was $202.3
million.
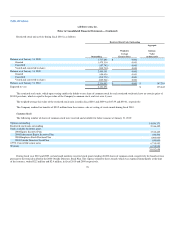
The following table summarizes information about stock options outstanding as of January 31, 2010:
Options Outstanding Options Exercisable
Range of Exercise
Prices
Number
Outstanding
Weighted-
Average
Remaining
Contractual
Life (Years)
Weighted-
Average
Exercise
Price
Number of
Shares
Weighted-
Average
Exercise
Price
$0.40 to $22.64 2,020,749 4.2 $ 10.16 2,020,123 $ 10.16
$23.05 to $25.19 168,161 4.8 24.56 161,003 24.56
$25.97 2,892,809 3.8 25.97 650,126 25.97
$27.20 to $39.35 2,090,709 2.6 33.78 1,411,438 33.62
$39.68 to $52.48 2,826,735 3.2 49.90 1,246,429 48.79
$52.76 to $65.41 1,065,604 3.4 56.04 377,866 55.44
$65.44 to $71.30 2,971,604 4.7 65.73 101,116 67.91
14,036,371 3.7 $ 40.36 5,968,101 $ 29.73
78