Salesforce.com 2009 Annual Report Download - page 48
Download and view the complete annual report
Please find page 48 of the 2009 Salesforce.com annual report below. You can navigate through the pages in the report by either clicking on the pages listed below, or by using the keyword search tool below to find specific information within the annual report.-
 1
1 -
2
-
3
-
4
-
5
-
6
-
7
-
8
-
9
-
10
-
11
-
12
-
13
-
14
-
15
-
16
-
17
-
18
-
19
-
20
-
21
-
22
-
23
-
24
-
25
-
26
-
27
-
28
-
29
-
30
-
31
-
32
-
33
-
34
-
35
-
36
-
37
-
 38
38 -
 39
39 -
 40
40 -
 41
41 -
 42
42 -
 43
43 -
 44
44 -
 45
45 -
 46
46 -
 47
47 -
 48
48 -
 49
49 -
 50
50 -
 51
51 -
 52
52 -
 53
53 -
 54
54 -
 55
55 -
 56
56 -
 57
57 -
 58
58 -
59
-
60
-
61
-
62
-
63
-
64
-
65
-
66
-
67
-
68
-
69
-
70
-
71
-
72
-
73
-
74
-
75
-
76
-
77
-
78
-
79
-
80
-
81
-
82
-
83
-
84
-
85
-
86
-
87
-
88
-
89
-
90
-
91
-
92
-
93
-
94
-
95
-
96
-
97
-
98
-
99
-
100
-
101
-
102
-
103
-
104
-
105
-
106
-
107
-
108
-
109
-
110
-
111
-
112
-
113
-
114
-
115
-
116
-
117
-
118
-
119
-
120
-
121
-
122
-
123
 |
 |

Table of Contents
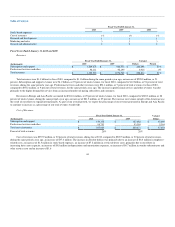
million in allocated overhead. The cost of the professional services headcount resulted in the cost of professional services and other revenues to be in excess
of the related revenue during fiscal 2010 by $2.6 million as compared to $1.2 million during fiscal 2009.
As described above, we intend to continue to invest additional resources in our enterprise cloud computing application service. The timing of these
additional expenses, will affect our cost of revenues, both in terms of absolute dollars and as a percentage of revenues.
We expect the cost of professional services and other revenue to continue to be in excess of the related revenue during fiscal 2011. We plan to make this
investment since our professional services are designed to facilitate the adoption of our application service. Additionally, as more professional service
arrangements are accounted for as a single unit of accounting with the related subscription service and recognized ratably over the term of the subscription
contract, our costs of professional services will exceed the related revenue recognized.
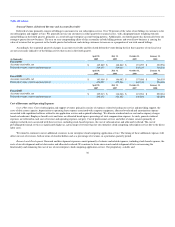
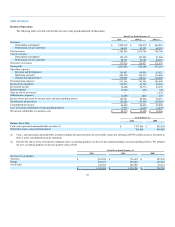
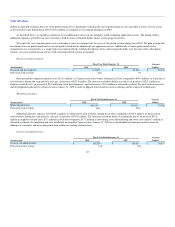
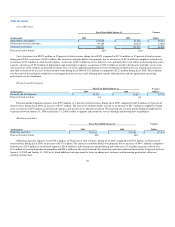
Research and Development.
Fiscal Year Ended January 31, Variance
Dollars
(In thousands) 2010 2009
Research and development $ 131,897 $ 99,530 $ 32,367
Percent of total revenues 10% 9%
Research and development expenses were $131.9 million, or 10 percent of total revenues, during fiscal 2010, compared to $99.5 million, or 9 percent of
total revenues, during the same period a year ago, an increase of $32.4 million. The increase in absolute dollars was due to an increase of $25.2 million in
employee-related costs, an increase of $3.3 million in stock-based expenses, and an increase of $3.5 million in allocated overhead. We increased our research
and development headcount by 24 percent since January 31, 2009 in order to upgrade and extend our service offerings and develop new technologies.
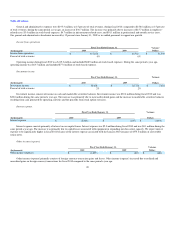
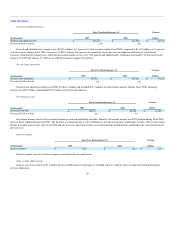
Marketing and Sales.
Fiscal Year Ended January 31, Variance
Dollars
(In thousands) 2010 2009
Marketing and sales $ 605,199 $ 534,413 $ 70,786
Percent of total revenues 46% 50%
Marketing and sales expenses were $605.2 million, or 46 percent of total revenues, during fiscal 2010, compared to $534.4 million, or 50 percent of
total revenues, during the same period a year ago, an increase of $70.8 million. The increase in absolute dollars was primarily due to increases of $42.0
million in employee-related costs, $3.7 million in stock-based expenses, $17.1 million in advertising costs and marketing and event costs and $6.7 million in
allocated overhead. Our marketing and sales headcount increased by 9 percent since January 31, 2009 as we hired additional sales personnel to focus on
adding new customers and increasing penetration within our existing customer base.
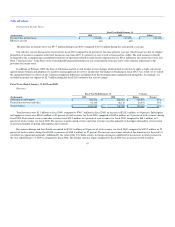
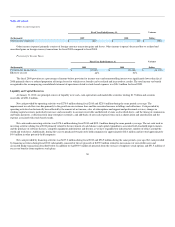
General and Administrative.
Fiscal Year Ended January 31, Variance
Dollars
(In thousands) 2010 2009
General and administrative $ 195,290 $ 158,613 $ 36,677
Percent of total revenues 15% 15%
45