Salesforce.com 2009 Annual Report Download - page 53
Download and view the complete annual report
Please find page 53 of the 2009 Salesforce.com annual report below. You can navigate through the pages in the report by either clicking on the pages listed below, or by using the keyword search tool below to find specific information within the annual report.-
 1
1 -
2
-
3
-
4
-
5
-
6
-
7
-
8
-
9
-
10
-
11
-
12
-
13
-
14
-
15
-
16
-
17
-
18
-
19
-
20
-
21
-
22
-
23
-
24
-
25
-
26
-
27
-
28
-
29
-
30
-
31
-
32
-
33
-
34
-
35
-
36
-
37
-
38
-
39
-
40
-
41
-
42
-
 43
43 -
 44
44 -
 45
45 -
 46
46 -
 47
47 -
 48
48 -
 49
49 -
 50
50 -
 51
51 -
 52
52 -
 53
53 -
 54
54 -
 55
55 -
 56
56 -
 57
57 -
 58
58 -
 59
59 -
 60
60 -
 61
61 -
 62
62 -
 63
63 -
64
-
65
-
66
-
67
-
68
-
69
-
70
-
71
-
72
-
73
-
74
-
75
-
76
-
77
-
78
-
79
-
80
-
81
-
82
-
83
-
84
-
85
-
86
-
87
-
88
-
89
-
90
-
91
-
92
-
93
-
94
-
95
-
96
-
97
-
98
-
99
-
100
-
101
-
102
-
103
-
104
-
105
-
106
-
107
-
108
-
109
-
110
-
111
-
112
-
113
-
114
-
115
-
116
-
117
-
118
-
119
-
120
-
121
-
122
-
123
 |
 |

Table of Contents
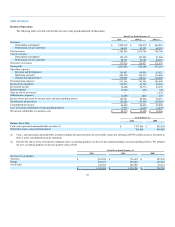
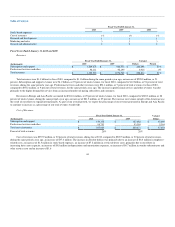
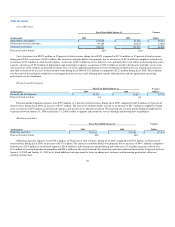
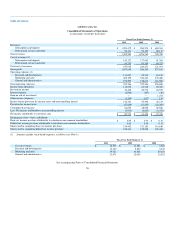
Other income (expense).
(In thousands)
Fiscal Year Ended January 31, Variance
Dollars 2009 2008
Other income (expense) $ (817) $ 139 $ (956)
Other income (expense) primarily consists of foreign currency transaction gains and losses. Other income (expense) decreased due to realized and
unrealized gains on foreign currency transactions for fiscal 2009 compared to fiscal 2008.
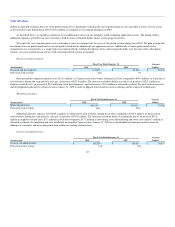
Provision for Income Taxes.
(In thousands)
Fiscal Year Ended January 31, Variance
Dollars 2009 2008
Provision for income taxes $ (37,557) $ (23,385) $ (14,172)
Effective tax rate 44% 51%
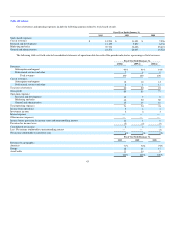
The fiscal 2009 provision as a percentage of income before provision for income taxes and noncontrolling interest was significantly lower than fiscal
2008 primarily due to a reduced proportion of foreign losses for which no tax benefit can be realized and increased tax credits. The total income tax benefit
recognized in the accompanying consolidated statement of operations related to stock-based expenses was $26.3 million for fiscal 2009.
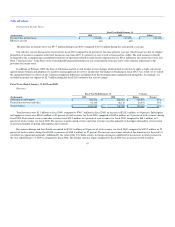
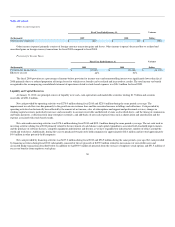
Liquidity and Capital Resources
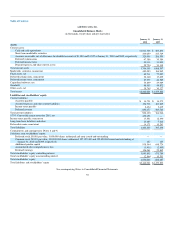
At January 31, 2010, our principal sources of liquidity were cash, cash equivalents and marketable securities totaling $1.7 billion and accounts
receivable of $321.0 million.
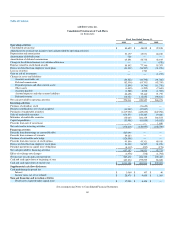
Net cash provided by operating activities was $270.9 million during fiscal 2010 and $229.6 million during the same period a year ago. The
improvement in cash flow was due primarily to the growth in our customer base and the associated increase in billings and collections. Cash provided by
operating activities has historically been affected by the amount of net income, sales of subscriptions and support and professional services, changes in
working capital accounts, particularly increases and seasonality in accounts receivable and deferred revenue as described above, and the timing of commission
and bonus payments, collections from large enterprise customers, and add-backs of non-cash expense items such as depreciation and amortization and the
expense associated with stock-based awards.
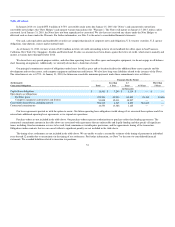
Net cash used in investing activities was $378.6 million during fiscal 2010 and $121.0 million during the same period a year ago. The net cash used in
investing activities during fiscal 2010 primarily related to the investment of cash balances and capital expenditures associated with leasehold improvements,
and the purchase of software licenses, computer equipment and furniture and fixtures as we have expanded our infrastructure, number of offices around the
world and work force. Additionally, during the year we purchased two privately held companies for approximately $12.0 million and invested approximately
$4.4 million in other privately-held companies.
Net cash provided by financing activities was $637.2 million during fiscal 2010 and $96.9 million during the same period a year ago. Net cash provided
by financing activities during fiscal 2010 substantially consisted of the net proceeds of $499.9 million related to our issuance of convertible notes and
associated hedge transactions described below. In addition we had $93.9 million of proceeds from the exercise of employee stock options and $51.5 million of
excess tax benefits from employee stock plans.
50