Salesforce.com 2009 Annual Report Download - page 37
Download and view the complete annual report
Please find page 37 of the 2009 Salesforce.com annual report below. You can navigate through the pages in the report by either clicking on the pages listed below, or by using the keyword search tool below to find specific information within the annual report.-
 1
1 -
2
-
3
-
4
-
5
-
6
-
7
-
8
-
9
-
10
-
11
-
12
-
13
-
14
-
15
-
16
-
17
-
18
-
19
-
20
-
21
-
22
-
23
-
24
-
25
-
26
-
 27
27 -
 28
28 -
 29
29 -
 30
30 -
 31
31 -
 32
32 -
 33
33 -
 34
34 -
 35
35 -
 36
36 -
 37
37 -
 38
38 -
 39
39 -
 40
40 -
 41
41 -
 42
42 -
 43
43 -
 44
44 -
 45
45 -
 46
46 -
 47
47 -
48
-
49
-
50
-
51
-
52
-
53
-
54
-
55
-
56
-
57
-
58
-
59
-
60
-
61
-
62
-
63
-
64
-
65
-
66
-
67
-
68
-
69
-
70
-
71
-
72
-
73
-
74
-
75
-
76
-
77
-
78
-
79
-
80
-
81
-
82
-
83
-
84
-
85
-
86
-
87
-
88
-
89
-
90
-
91
-
92
-
93
-
94
-
95
-
96
-
97
-
98
-
99
-
100
-
101
-
102
-
103
-
104
-
105
-
106
-
107
-
108
-
109
-
110
-
111
-
112
-
113
-
114
-
115
-
116
-
117
-
118
-
119
-
120
-
121
-
122
-
123
 |
 |
Table of Contents
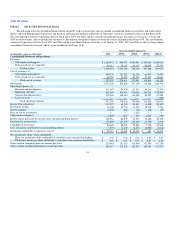
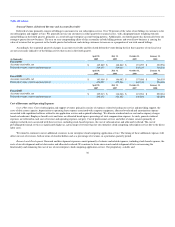
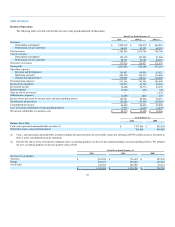
ITEM 6. SELECTED FINANCIAL DATA
The following selected consolidated financial data should be read in conjunction with our audited consolidated financial statements and related notes
thereto and with Management's Discussion and Analysis of Financial Condition and Results of Operation, which are included elsewhere in this Form 10-K.
The consolidated statement of operations data for fiscal 2010, 2009 and 2008, and the selected consolidated balance sheet data as of January 31, 2010 and
2009 are derived from, and are qualified by reference to, the audited consolidated financial statements and are included in this Form 10-K. The consolidated
statement of operations data for fiscal 2007 and 2006 and the consolidated balance sheet data as of January 31, 2008, 2007 and 2006 are derived from audited
consolidated financial statements which are not included in this Form 10-K.
(in thousands, except per share data)
Fiscal Year Ended January 31,
2010 2009(4) 2008(4) 2007(4) 2006(4)
Consolidated Statement of Operations:
Revenues:
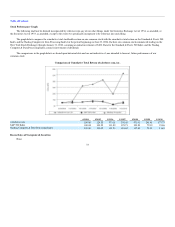
Subscription and support $ 1,209,472 $ 984,574 $ 680,581 $ 451,660 $ 280,639
Professional services and other 96,111 92,195 68,119 45,438 29,218
Total revenues 1,305,583 1,076,769 748,700 497,098 309,857
Cost of revenues (1):
Subscription and support 159,172 127,082 91,268 61,457 34,457
Professional services and other 98,753 93,389 80,323 57,433 34,669
Total cost of revenues 257,925 220,471 171,591 118,890 69,126
Gross profit 1,047,658 856,298 577,109 378,208 240,731
Operating expenses (1):
Research and development 131,897 99,530 63,812 44,614 23,330
Marketing and sales 605,199 534,413 376,480 252,935 149,598
General and administrative 195,290 158,613 116,508 84,257 47,986
Lease recovery — — — — (285)
Total operating expenses 932,386 792,556 556,800 381,806 220,629
Income from operations 115,272 63,742 20,309 (3,598) 20,102
Investment income 30,408 22,774 24,539 14,975 7,726
Interest expense (2,000) (107) (46) (191) (69)
Gain on sale of investment — — 1,272 — —
Other income (expense) (1,299) (817) 139 1,310 439
Income before provision for income taxes and noncontrolling interest 142,381 85,592 46,213 12,496 28,198
Provision for income taxes (57,689) (37,557) (23,385) (9,795) 1,310
Consolidated net income 84,692 48,035 22,828 2,701 29,508
Less: net income attributable to noncontrolling interest (3,973) (4,607) (4,472) (2,220) (1,034)
Net income attributable to salesforce.com (2) $ 80,719 $ 43,428 $ 18,356 $ 481 $ 28,474
Net earnings per share—basic and diluted:
Basic net income per share attributable to salesforce.com common shareholders $ 0.65 $ 0.36 $ 0.16 $ 0.00 $ 0.27
Diluted net income per share attributable to salesforce.com common shareholders $ 0.63 $ 0.35 $ 0.15 $ 0.00 $ 0.24
Shares used in computing basic net income per share 124,462 121,183 116,840 112,386 107,274
Shares used in computing diluted net income per share 128,114 125,228 122,422 120,154 118,737
34