Salesforce.com 2009 Annual Report Download - page 46
Download and view the complete annual report
Please find page 46 of the 2009 Salesforce.com annual report below. You can navigate through the pages in the report by either clicking on the pages listed below, or by using the keyword search tool below to find specific information within the annual report.-
 1
1 -
2
-
3
-
4
-
5
-
6
-
7
-
8
-
9
-
10
-
11
-
12
-
13
-
14
-
15
-
16
-
17
-
18
-
19
-
20
-
21
-
22
-
23
-
24
-
25
-
26
-
27
-
28
-
29
-
30
-
31
-
32
-
33
-
34
-
35
-
 36
36 -
 37
37 -
 38
38 -
 39
39 -
 40
40 -
 41
41 -
 42
42 -
 43
43 -
 44
44 -
 45
45 -
 46
46 -
 47
47 -
 48
48 -
 49
49 -
 50
50 -
 51
51 -
 52
52 -
 53
53 -
 54
54 -
 55
55 -
 56
56 -
57
-
58
-
59
-
60
-
61
-
62
-
63
-
64
-
65
-
66
-
67
-
68
-
69
-
70
-
71
-
72
-
73
-
74
-
75
-
76
-
77
-
78
-
79
-
80
-
81
-
82
-
83
-
84
-
85
-
86
-
87
-
88
-
89
-
90
-
91
-
92
-
93
-
94
-
95
-
96
-
97
-
98
-
99
-
100
-
101
-
102
-
103
-
104
-
105
-
106
-
107
-
108
-
109
-
110
-
111
-
112
-
113
-
114
-
115
-
116
-
117
-
118
-
119
-
120
-
121
-
122
-
123
 |
 |
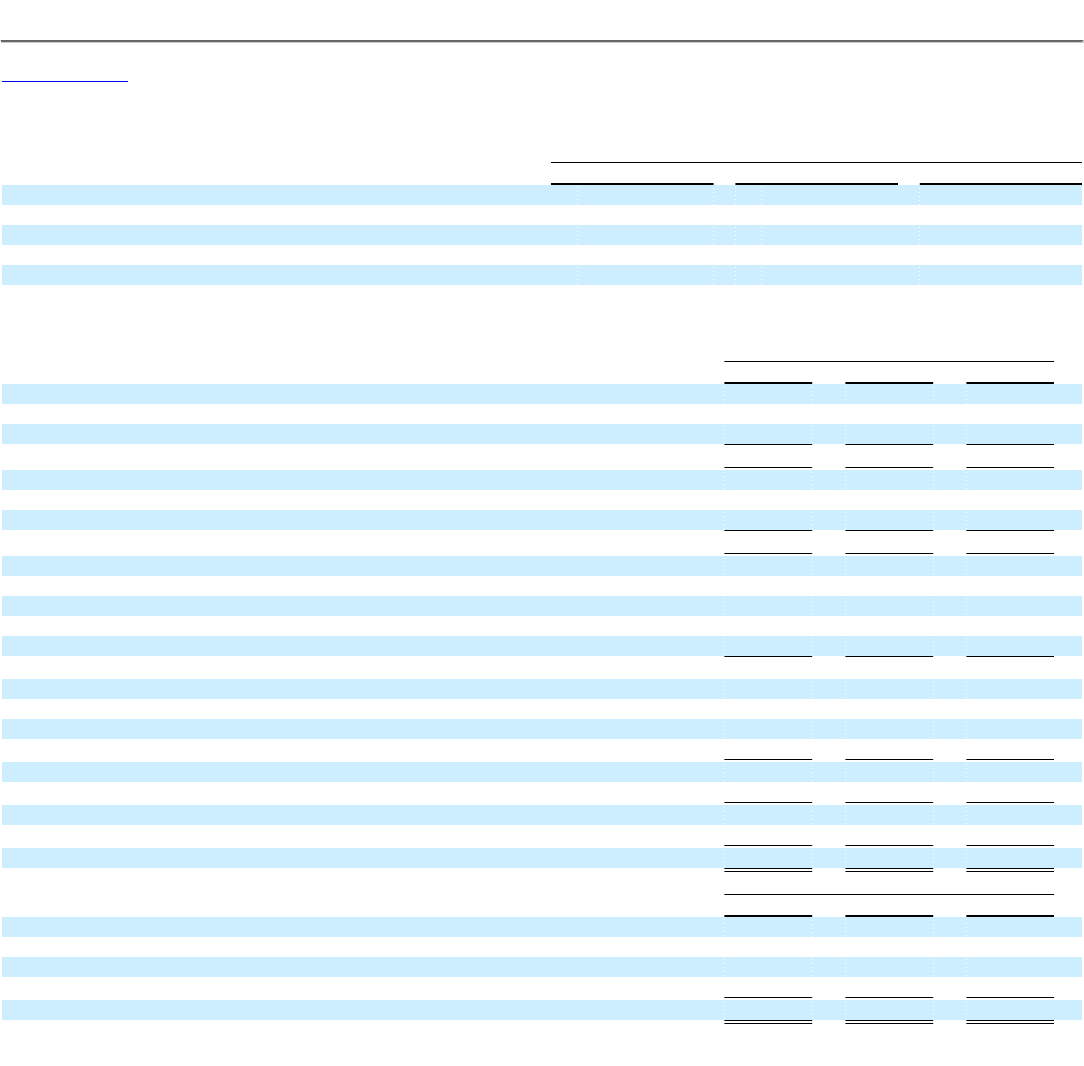
Table of Contents
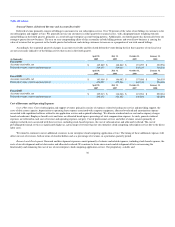
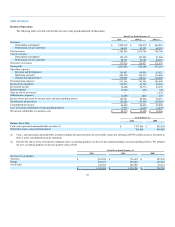
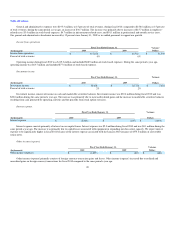
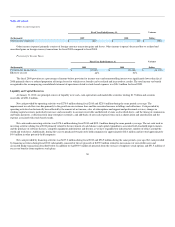
Cost of revenues and operating expenses include the following amounts related to stock-based awards.
Fiscal Year Ended January 31,
2010 2009 2008
Stock-based expenses:
Cost of revenues $ 12,570 $ 11,051 $ 7,926
Research and development 13,129 9,852 6,336
Marketing and sales 39,722 36,028 25,423
General and administrative 23,471 20,435 15,522
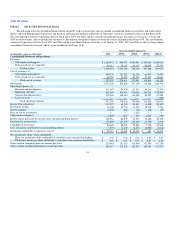
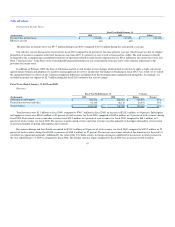
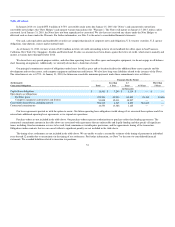
The following tables set forth selected consolidated statements of operations data for each of the periods indicated as a percentage of total revenues.
Fiscal Year Ended January 31,
2010(2) 2009(2) 2008(2)
Revenues:
Subscription and support 93% 91% 91%
Professional services and other 7 9 9
Total revenues 100 100 100
Cost of revenues:
Subscription and support 12 12 12
Professional services and other 8 8 11
Total cost of revenues 20 20 23
Gross profit 80 80 77
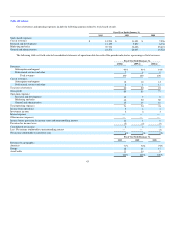
Operating expenses:
Research and development 10 9 8
Marketing and sales 46 50 50
General and administrative 15 15 16
Total operating expenses 71 74 74
Income from operations 9 6 3
Investment income 2 2 3
Interest expense — — —
Other income (expense) — — —
Income before provision for income taxes and noncontrolling interest 11 8 6
Provision for income taxes (5) (4) (3)
Consolidated net income 6 4 3
Less: Net income attributable to noncontrolling interest — — (1)
Net income attributable to salesforce.com 6% 4% 2%
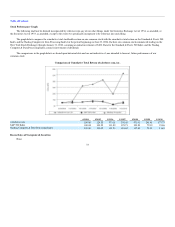
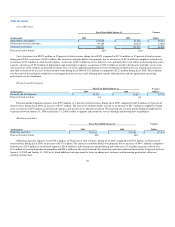
Fiscal Year Ended January 31,
2010 2009 2008
Revenues by geography:
Americas 71% 72% 75%
Europe 18 18 17
Asia Pacific 11 10 8
100% 100% 100%
43