Salesforce.com 2009 Annual Report Download - page 38
Download and view the complete annual report
Please find page 38 of the 2009 Salesforce.com annual report below. You can navigate through the pages in the report by either clicking on the pages listed below, or by using the keyword search tool below to find specific information within the annual report.-
 1
1 -
2
-
3
-
4
-
5
-
6
-
7
-
8
-
9
-
10
-
11
-
12
-
13
-
14
-
15
-
16
-
17
-
18
-
19
-
20
-
21
-
22
-
23
-
24
-
25
-
26
-
27
-
 28
28 -
 29
29 -
 30
30 -
 31
31 -
 32
32 -
 33
33 -
 34
34 -
 35
35 -
 36
36 -
 37
37 -
 38
38 -
 39
39 -
 40
40 -
 41
41 -
 42
42 -
 43
43 -
 44
44 -
 45
45 -
 46
46 -
 47
47 -
 48
48 -
49
-
50
-
51
-
52
-
53
-
54
-
55
-
56
-
57
-
58
-
59
-
60
-
61
-
62
-
63
-
64
-
65
-
66
-
67
-
68
-
69
-
70
-
71
-
72
-
73
-
74
-
75
-
76
-
77
-
78
-
79
-
80
-
81
-
82
-
83
-
84
-
85
-
86
-
87
-
88
-
89
-
90
-
91
-
92
-
93
-
94
-
95
-
96
-
97
-
98
-
99
-
100
-
101
-
102
-
103
-
104
-
105
-
106
-
107
-
108
-
109
-
110
-
111
-
112
-
113
-
114
-
115
-
116
-
117
-
118
-
119
-
120
-
121
-
122
-
123
 |
 |
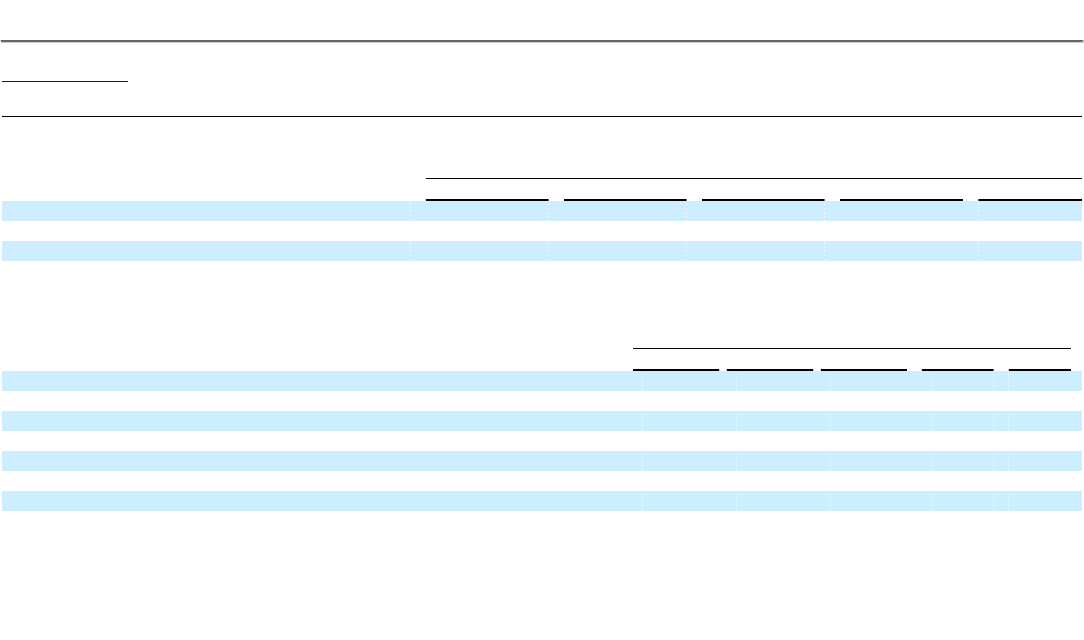
Table of Contents
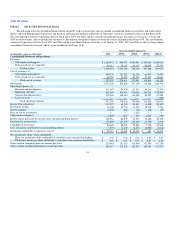
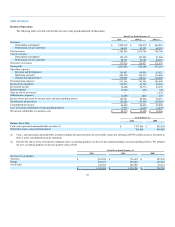
(1) Cost of revenues and operating expenses include stock-based expenses, consisting of:
Fiscal Year Ended January 31,
2010 2009 2008 2007 2006
Cost of revenues $ 12,570 $ 11,051 $ 7,926 $ 5,522 $ 575
Research and development 13,129 9,852 6,336 4,523 332
Marketing and sales 39,722 36,028 25,423 18,392 1,325
General and administrative 23,471 20,435 15,522 10,768 1,216
(2) Net income attributable to salesforce.com during fiscal 2006 included a $6.8 million income tax benefit for partial release of valuation allowance.
As of January 31,
2010 2009(4) 2008(4) 2007(4) 2006(4)
Consolidated Balance Sheet Data:
Cash, cash equivalents and marketable securities $ 1,727,048 $ 882,565 $ 669,800 $ 412,512 296,792
Working capital 798,029 301,591 134,894 45,905 68,592
Total assets 2,460,201 1,479,822 1,089,593 664,832 434,749
Long-term obligations excluding deferred revenue and noncontrolling interest (3) 481,234 20,106 10,601 1,408 1,339
Retained earnings (deficit) 106,561 25,842 (17,586) (35,633) (36,114)
Total stockholders' equity controlling interest 1,043,802 671,784 452,059 281,791 196,371
(3) Long-term obligations excluding deferred revenue and noncontrolling interest includes the $450.2 million 0.75% convertible senior notes issued in
January 2010 as described in Note 2 of the consolidated financial statements.
(4) Includes the effects of the retrospective adoption of new accounting guidance for the new presentation guidance for noncontrolling interest. We adopted
the new accounting guidance in the first quarter of fiscal 2010.
35