Salesforce.com 2009 Annual Report Download - page 68
Download and view the complete annual report
Please find page 68 of the 2009 Salesforce.com annual report below. You can navigate through the pages in the report by either clicking on the pages listed below, or by using the keyword search tool below to find specific information within the annual report.-
 1
1 -
2
-
3
-
4
-
5
-
6
-
7
-
8
-
9
-
10
-
11
-
12
-
13
-
14
-
15
-
16
-
17
-
18
-
19
-
20
-
21
-
22
-
23
-
24
-
25
-
26
-
27
-
28
-
29
-
30
-
31
-
32
-
33
-
34
-
35
-
36
-
37
-
38
-
39
-
40
-
41
-
42
-
43
-
44
-
45
-
46
-
47
-
48
-
49
-
50
-
51
-
52
-
53
-
54
-
55
-
56
-
57
-
 58
58 -
 59
59 -
 60
60 -
 61
61 -
 62
62 -
 63
63 -
 64
64 -
 65
65 -
 66
66 -
 67
67 -
 68
68 -
 69
69 -
 70
70 -
 71
71 -
 72
72 -
 73
73 -
 74
74 -
 75
75 -
 76
76 -
 77
77 -
 78
78 -
79
-
80
-
81
-
82
-
83
-
84
-
85
-
86
-
87
-
88
-
89
-
90
-
91
-
92
-
93
-
94
-
95
-
96
-
97
-
98
-
99
-
100
-
101
-
102
-
103
-
104
-
105
-
106
-
107
-
108
-
109
-
110
-
111
-
112
-
113
-
114
-
115
-
116
-
117
-
118
-
119
-
120
-
121
-
122
-
123
 |
 |
Table of Contents
salesforce.com, inc.
Notes to Consolidated Financial Statements—(Continued)
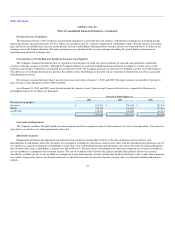
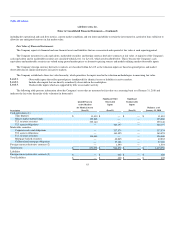
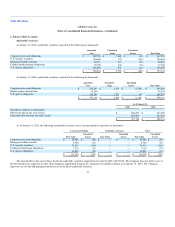
The Company has certain investments in privately-held companies. Management evaluated the financial results, earnings trends, and subsequent
financing of these companies, as well as general market conditions, to determine fair value. The following table presents information about the Company's
assets that are measured at fair value on a non-recurring basis as of January 31, 2010 and the losses recorded during the year ended January 31, 2010 on these
assets (in thousands):
Description
Net Carrying
Value as of
January 31, 2010
Significant
Unobservable
Inputs (Level 3)
Total Losses for
Year Ended
January 31, 2010
Investments in privately-held companies $ 6,288 $ 6,288 $ (512)
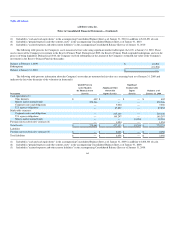
The following table presents information about the Company's assets that are measured at fair value on a non-recurring basis as of January 31, 2009 and
the losses recorded during the year ended January 31, 2009 on these assets (in thousands):
Description
Net Carrying
Value as of
January 31, 2009
Significant
Unobservable
Inputs
(Level 3)
Total Losses for
Year Ended
January 31, 2009
Investments in privately-held companies $ 2,400 $ 2,400 $ (100)
Derivative Financial Instruments
The Company enters into foreign currency derivative contracts with financial institutions to reduce the risk that its cash flows and earnings will be
adversely affected by foreign currency exchange rate fluctuations. The Company uses forward currency derivative contracts to minimize the Company's
exposure of balances denominated in Euros, Swiss francs, Australian dollars, Singapore dollars, Japanese yen and British pounds. The Company's program is
not designated for trading or speculative purposes. As of January 31, 2010 the foreign currency derivative contracts that were not settled are recorded at fair
value on the consolidated balance sheet.
The Company's foreign currency derivative contracts which are not designated as hedging instruments are used to reduce the exchange rate risk
associated primarily with intercompany receivables and payables. Foreign currency derivative contracts are marked-to-market at the end of each reporting
period with gains and losses recognized as other income (expense) to offset the gains or losses resulting from the settlement or remeasurement of the
underlying foreign currency denominated receivables and payables. While the contract or notional amount is often used to express the volume of foreign
currency derivative contracts, the amounts potentially subject to credit risk are generally limited to the amounts, if any, by which the counterparties'
obligations under the agreements exceed the obligations of the Company to the counterparties.
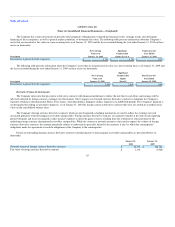
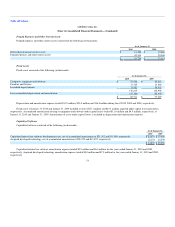
Details on outstanding foreign currency derivative contracts related primarily to intercompany receivables and payables are presented below (in
thousands):
January 31,
2010
January 31,
2009
Notional amount of foreign currency derivative contracts $ 74,705 $ 158,704
Fair value of foreign currency derivative contracts $ 1,191 (1,004)
65